Investor Sentiment
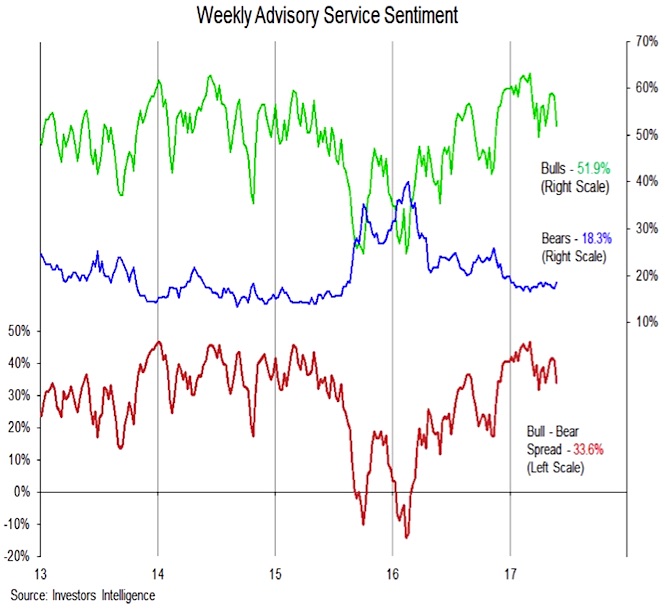
Optimism remains present in the weekly sentiment surveys. The NAAIM Exposure Index rose this week to a 12-week high, as active managers are fully exposed to equities. Among advisory services measured by Investors Intelligence, 52% are bulls and only 18% are bears.
Optimism here is off its recent peak but is still elevated. With both the Advisory Service sentiment and the NAAIM index, risks for stocks increase when optimism retreats significantly, but the caveat is that optimism can remain elevated for extended periods of time.
Equity Fund Flows
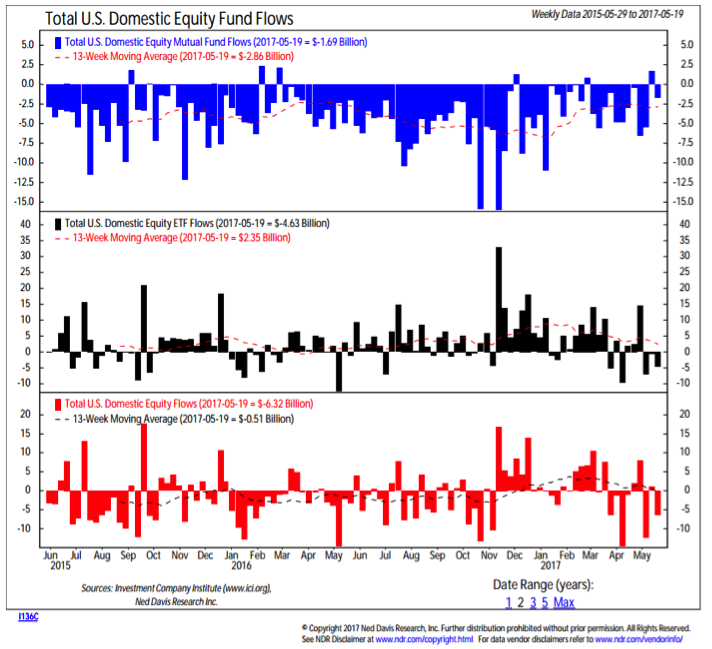
While investors express optimism (even the AAII survey of individual investors showed a 9% jump in bulls this week), fund flow data paint a different picture.
U.S. equity funds are again seeing outflows. Equity ETF’s saw outflows of $4.6 billion last week ($3.4 billion from a single small-cap ETF), marking the third week in a row of outflows. While the sentiment surveys suggest optimism (and perhaps complacency), it is hard to make an argument that investors are euphoric at a time when they are moving funds away from U.S. equities.
U.S. Dollar Index
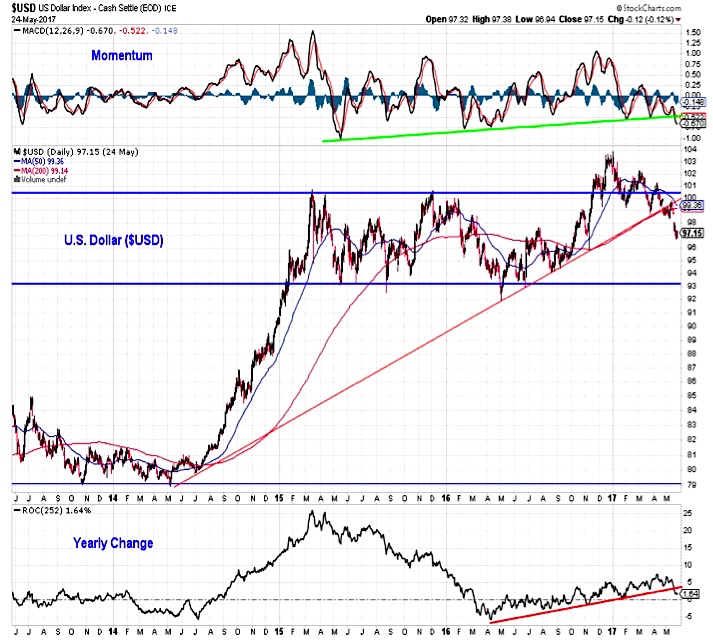
Unlike the optimism that is seen in stocks, sentiment indicators suggest investors are excessively pessimistic about the U.S. Dollar. A look at the chart helps explain why this change in heart (coming into 2017 optimism around the dollar was widespread). The up-trend in the dollar has failed to hold support following a false breakout, and both momentum and the yearly change have slipped below rising trend lines. Contrary to sentiment indicators for stocks, excessive pessimism for the dollar tends to lead to further price weakness. Weakness in the dollar has been a boon to Technology stocks and a big reason they are the leading sector in the S&P 500.
S&P Utilities Sector
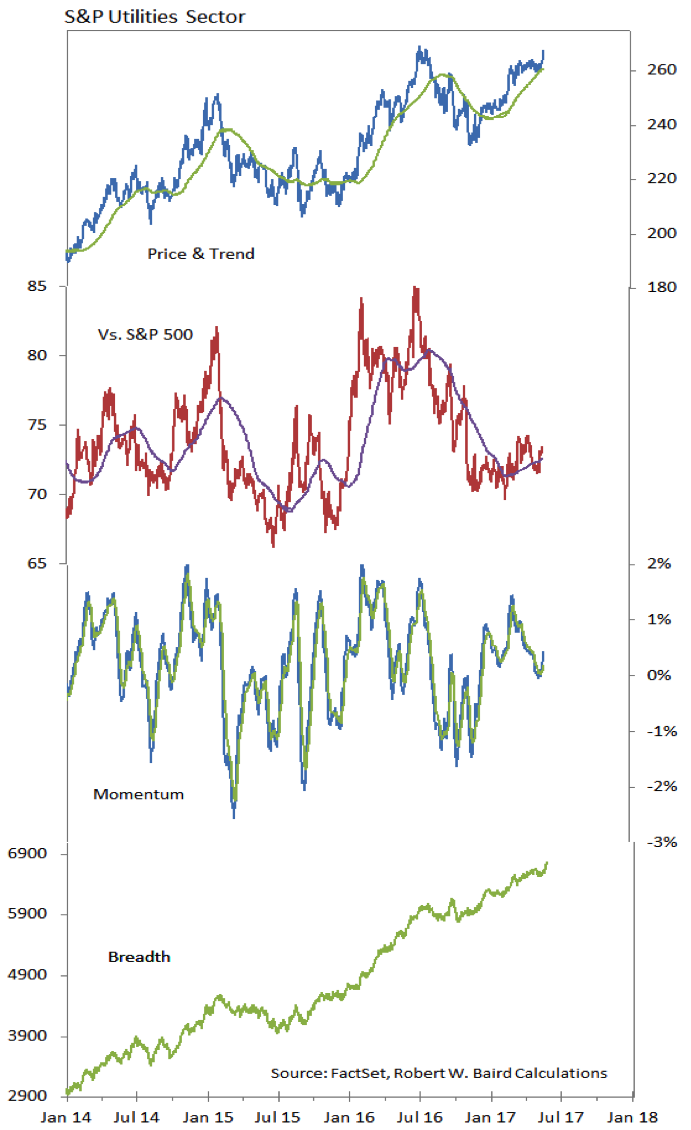
Bond yields have remained relatively low as the S&P 500 has rallied to new highs. This has been a source of strength for the Utilities sector, which has been the second strongest sector in the overall index over the past month (trailing only Technology). From a technical perspective, Utilities have improved significantly. The price trend is higher (Utilities are making new highs), momentum is expanding and breadth is strong. One area of weakness from a technical perspective is the relative price trend, which has been lackluster. The sector could also be vulnerable to a back-up in bond yields.
Thanks for reading.
Twitter: @WillieDelwiche
Any opinions expressed herein are solely those of the author, and do not in any way represent the views or opinions of any other person or entity.


