In this week’s investing research outlook, we analyze the current trend of the S&P 500 Index (INDEXSP:.INX), key stock market indicators, and discuss emerging themes and news that we are watching closely in our investing research.
Here’s a summary of our findings:
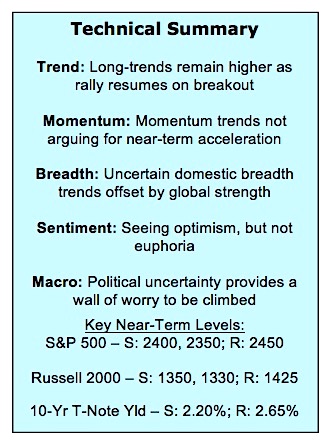
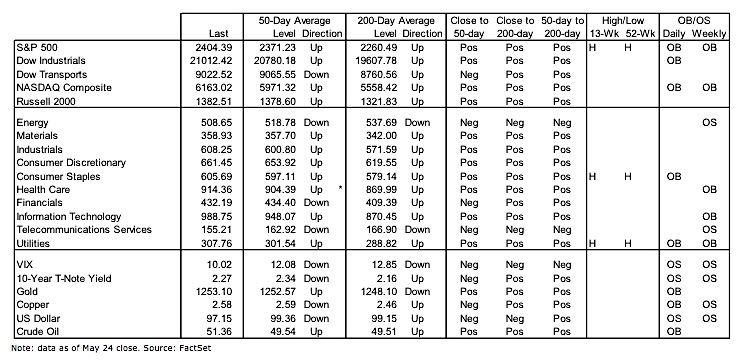
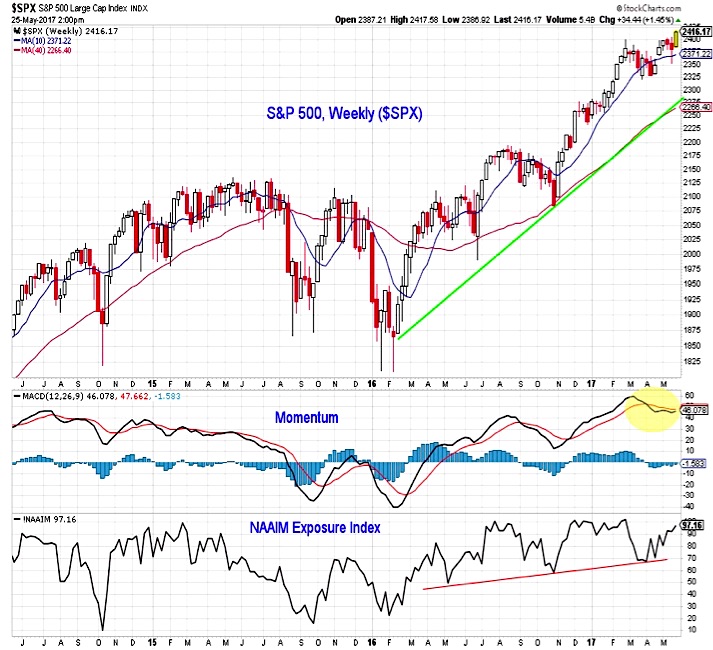
Index-Level Highs Providing More Questions Than Answers – The S&P 500 has rejected thoughts of consolidation, rallying to and now through resistance near 2400. The most bullish thing stocks can do is go up, but manner in which the new highs are being made is a bit of a head-scratcher. Momentum is not showing strength and joining the S&P 500 in making new highs on Wednesday were the NASDAQ and Utilities.
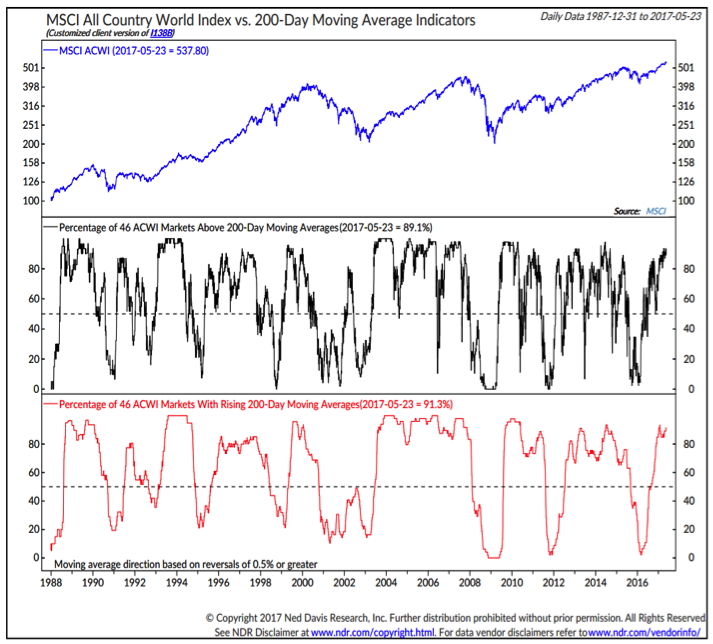
Global Breadth Trends Remain Strong, Even With S&P 500 Internal Weakness – Domestic breadth trends have stabilized and there is hopeful evidence of improvement. Issue-level indicators have yet to confirm the strength seen among the indexes. Offsetting this is the wide participation around the world. The strongest rallies occur when all areas are in gear and that seems to be the case in 2017 when looked at from a global perspective.
Sentiment Mixed With Survey Optimism Offset By Equity Fund Outflows – Weekly sentiment surveys continue to show elevated levels of optimism. Absent however, is euphoria, as fund flow data shows investors shifting assets away from U.S. equities in recent weeks (including $3.4 billion from small-caps last week).
Stock Market Indicators
S&P 500 Index
The S&P 500 is making new highs (now up to 18 for the year) and that is, in the end, the most bullish thing it can do. Contrary to what many seem to fear, new highs tend to beget more new highs (weakness, on the other hand, tends to come after stocks fail to make new highs). Without distracting from the up-trend that is intact and needs to be given the benefit of the doubt, the current rally is lacking some style points. Leadership areas like broker/dealers and the Dow Transports have yet to participate in the rally, and momentum for the S&P 500 continues to drift lower. For now this is more puzzling than troubling, but it bears watching.
S&P 500 Market Breadth
Domestic breadth trends have been more characterized by a lack of strength than by marked or specific S&P 500 internal weakness. While the percentage of S&P 500 stocks trading above their 200-day averages has slipped form its Q1 peak near 83% it has improved over the past week and remain more elevated than what was seen in the fourth quarter of 2016. Similarly, the 10-day total of new highs less new lows continues to show that more stocks are making new highs than new lows, although the number of new highs is relatively muted. An expansion in new highs and the percentage of stocks trading above their 200-day averages would help confirm the strength seen on the S&P 500.
Global Equities Breadth Trends
Breadth trends in the U.S. have deteriorated in recent weeks, but the 2017 rally remains a global trend. Looking around the world, more than 90% of markets are trading above their 200-day averages and the same percentage has 200-day averages that are rising. This helps keep our view on breadth overall as bullish.

continue reading on the next page…


