In this week’s investing research outlook, we will analyze the current trend of the S&P 500 Index (INDEXSP:.INX), check in on investor sentiment and market breadth indicators, and discuss emerging themes and news that we are watching right now.
Here’s a summary of our findings for the week ending September 22, 2017:
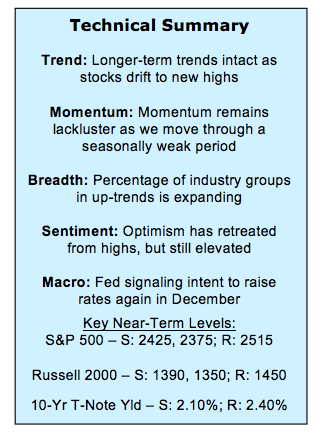
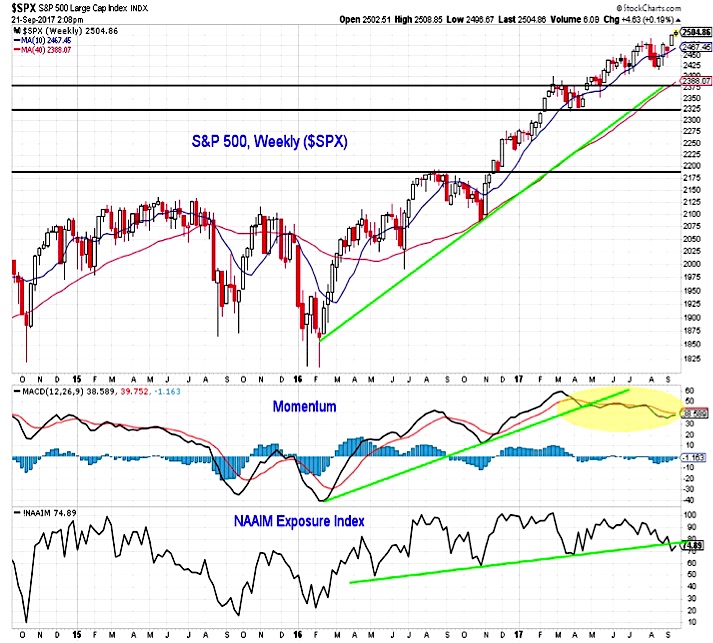
Indexes Make New Highs, but Momentum Still Lacking – The S&P 500 (NYSEARCA:SPY) has continued to drift higher into record territory, closing at new all-time highs every day this week. While daily momentum has improved, the weekly momentum trend remains lackluster. On the positive side, the small-cap Russell 2000 and the Dow Transports are on the cusp of new highs of their own.
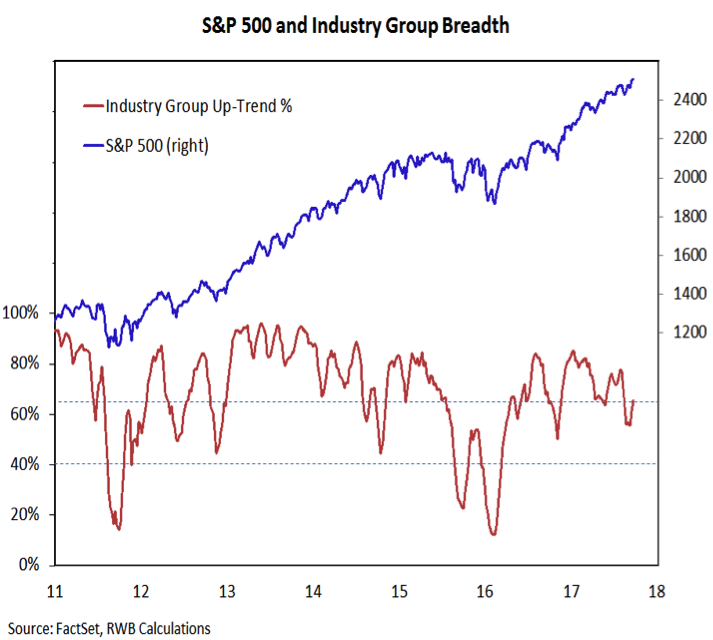
Broad Market Healing – Breadth indicators have been improving since their mid-August weakness. The recovery, however, has been less than explosive. This matches the lack of momentum seen at the index level and more breadth gains may be needed to confirm the highs seen there.
Sentiment Argues for Caution – Short-term sentiment on stocks is on the cusp of showing excessive optimism, while the longer-term sentiment indicators show that optimism is receding while pessimism is shy of extremes.
Bond Yields Turning Higher – Bond yields bounced off their recent lows and are moving higher at a time when bond market sentiment is approaching excessive optimism.
Stock Market Indicators
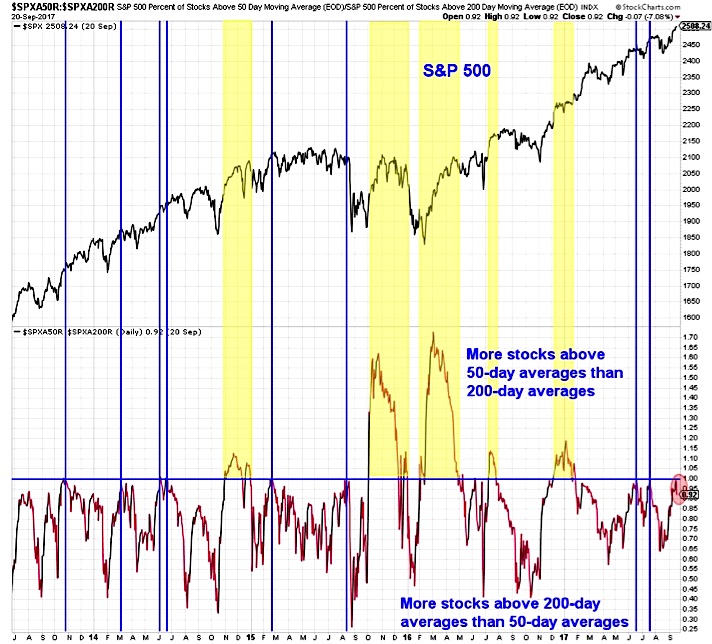
S&P 500 Index
The longer-term price up-trend for the S&P 500 remains intact. Two trends, however, that supported the cyclical rally over the course of 2016 have faded in 2017. Momentum has stalled and optimism is now ebbing (but still shy of anything approaching excessive pessimism). A turn higher in the momentum trend could help fuel a fourth quarter rally, but for now it is more a headwind than a tailwind.
The percentage of industry groups in up-trends is improving – and is set to rise to 66% this week (up from the mid-50s just a few weeks ago). While this improvement is encouraging, we need to see a reading above the late-July high (near 78%) to avoid a pattern of lower highs and lower lows. A failure to show sustained strength could signal a divergence between the S&P 500 and this breadth indicator.
The lack of momentum at the index level is echoed in the breadth indicators. While both the percentage of stocks trading above their 50-day average and the percentage trading above their 200-day averages has improved over the past month, we have yet to see the sort of near-term strength that pushes the 50-day number above the 200-day number. When this has happened over the past few years, the S&P has seen near-term follow through. The failure for the 50-day number to surpass the 200-day number has tended to suggest that near-term stock market strength is fading.
continue reading on the next page…


 – Warren Buffett’s Biggest Holding!")
 May Tip Stock Market’s Next Move")


