S&P 500 Weekly Market Outlook & Technical Review – October 14
Here’s a look at some key stock market indicators and emerging themes that we are watching in our latest S&P 500 Weekly Stock Market Outlook:
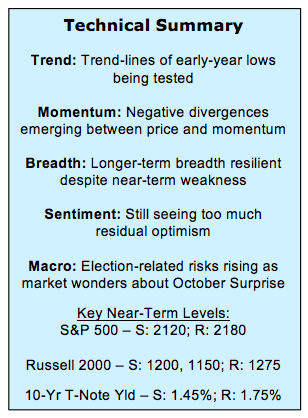
Tests of Support – Up-trends off of the early-year lows on the S&P 500 (INDEXSP:.INX) are being tested (and in many cases broken) as the third-quarter consolidation has moved into the fourth quarter. This is putting increased attention on areas that have offered support earlier this year.
Not Seeing Evidence of Capitulation – The inability of the popular averages to sustain advances seems to stem from continued deterioration in issue-level trends. The percentage of stocks trading above their 50-day and 200-day averages is contracting, but has not reached levels typically associated with oversold bounces. Likewise, recent TRIN readings suggest that selling pressure has remained shy of the excessive levels typically seen at sustainable lows.
Longer-Term Breadth Trends Still OK – The percentage of industry groups in up-trends has contracted, but as long as it remains above 50%, near-term weakness is likely to be limited in degree. Likewise, the lack of new highs being seen on the NYSE and NASDAQ (INDEXNASDAQ:.IXIC) speaks against an upside breakout, but the lack of new lows suggests downside is limited.
Stock Market Indicators
S&P 500 Index
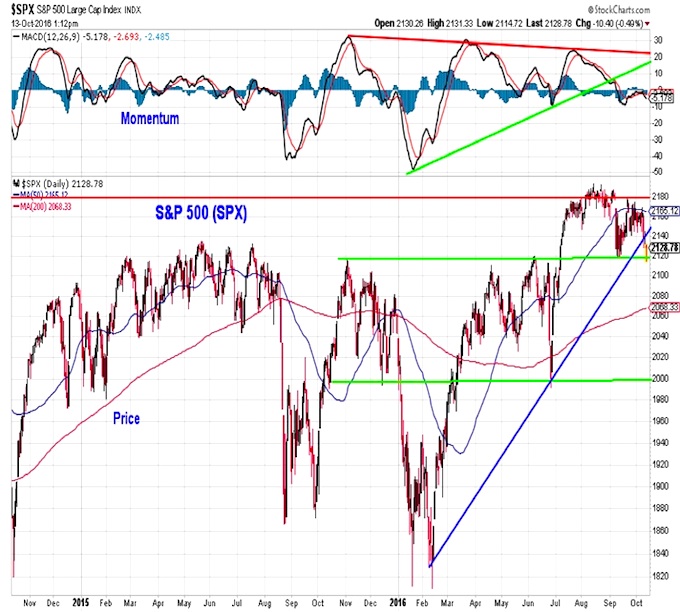
Momentum failed to confirm the summer price highs on the S&P 500 and since September has been arguing that downside risks may be building. That is now starting to be seen from a price perspective. The S&P 500 has broken below the up-trend line off of its February and June lows, but so far support near 2120 has held. A typical pattern would be for an attempt to regain that trend line, with a failure then opening the door to more pronounced weakness (the 200-day average, near 2065, and the June low, near 2000) are the next significant support levels if 2120 does not hold.
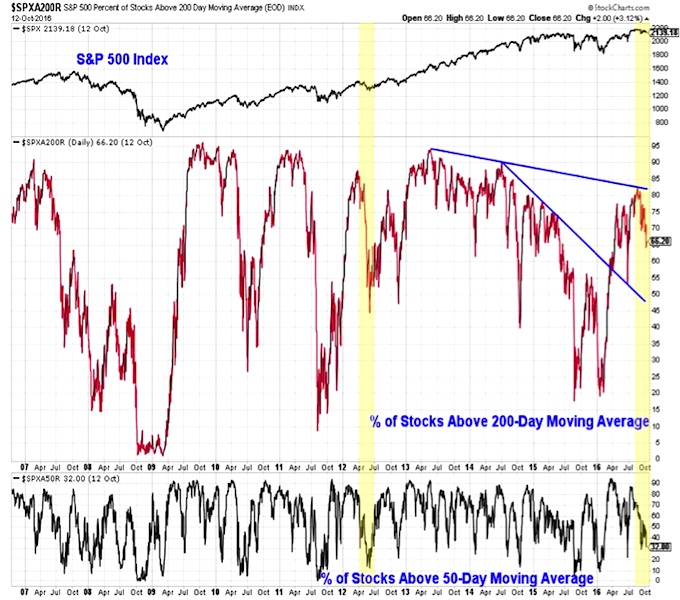
The S&P 500 is also being strained by near-term issue level deterioration. Only one-third of the stocks in the S&P 500 are currently trading above their 50-day averages and only two-thirds are trading above their 200-day averages. Both of those indicators peaked above 80% early in the third quarter. The problem is that we are seeing readings that neither point to underlying strength beyond what is being seen on the index itself nor have we seen a significant washout that would suggest stocks have gotten oversold. For now, it looks more consistent with further deterioration.
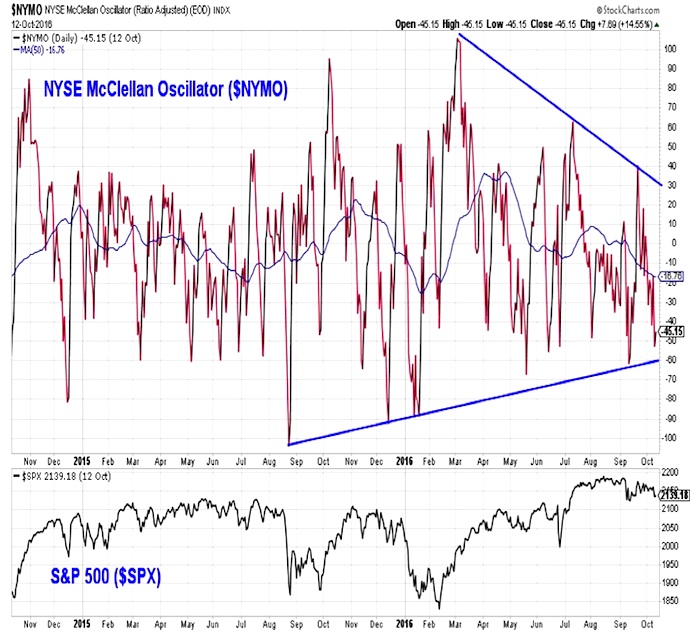
The McClellan Oscillator combines the ideas of momentum and breadth to look at broad market momentum. For now, we continue to see a pattern of higher lows (off of the late-2015 bottom) and lower highs (off of the early-2016 peak). As these two trend-lines converge, a break of one becomes almost inevitable. That could provide a signal for the next meaningful move for stocks.
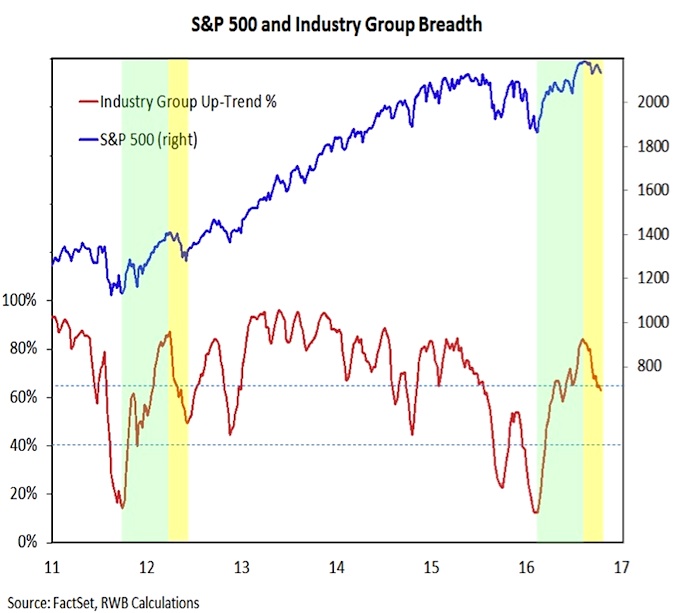
While near-term breadth indicators have turned more uncertain, the improvement in longer-term breadth trends seen over the first half of 2016 (and which stand in sharp contrast to the experience of 2015) remains encouraging. The percentage of industry groups in up-trends has slipped over the past several months, but it remains above 60%. Using 2012 as an example, we could see the industry group indicator pull back somewhat further. A break below 50% would represent a meaningful deterioration in the broad market.
continue reading on the next page…


