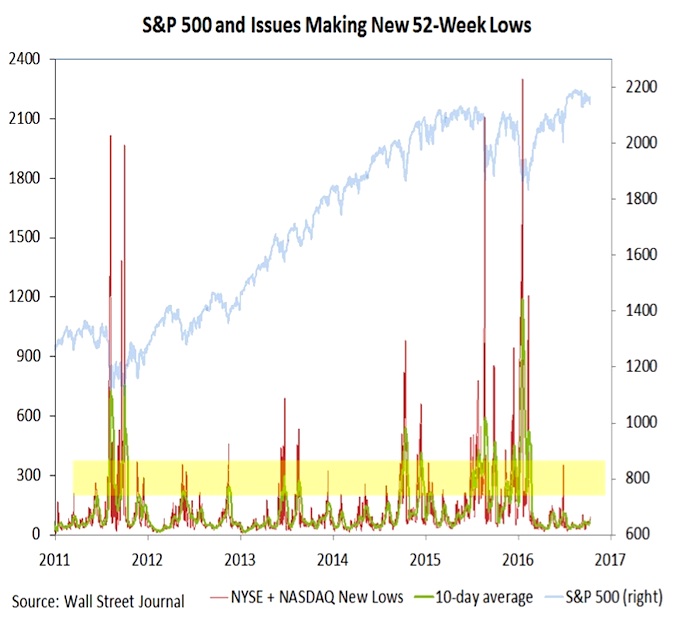
We have talked in the past about the lack of issues making new 52-week highs, and how that suggests that stocks overall are not poised to breakout to the upside.
It is worth pointing out that we have not seen a meaningful expansion in the number of stocks making new lows. A modest rise in new lows could actually signal a selling climax (as was the case in June), but if near-term weakness is not a prelude to a protracted pullback, the number of issues making new lows should stay fairly modest (300-400 on a combined NYSE+NASDAQ basis).
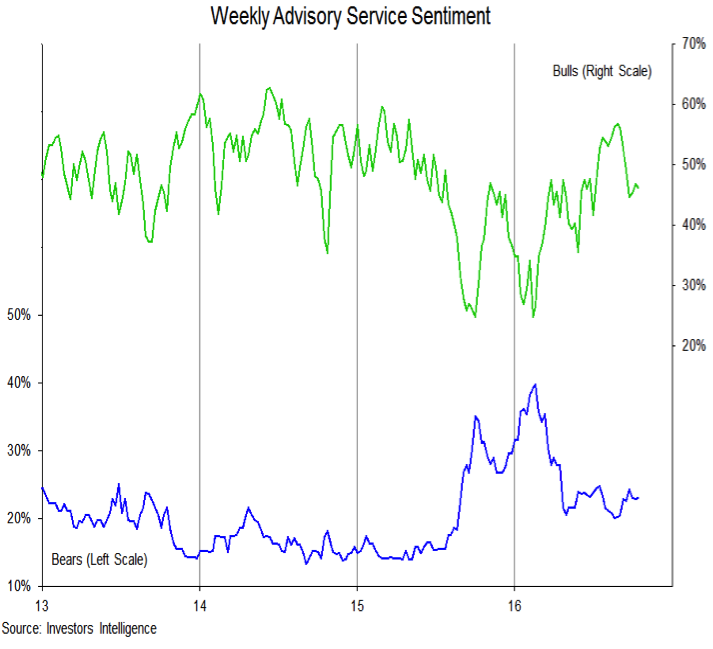
Investor Sentiment
Sentiment measures overall have become more mixed. Options data show some evidence of caution and the short-term oriented Trading Sentiment Composite (from Ned Davis Research) is moved back into the excessive pessimism zone. The AAII survey of individual investors shows both bulls and bears moving within zones that seem to indicate a lack of conviction in either direction. The NAAIM exposure index rose this week to highest level since the first week of September, although the median exposure is at its lowest level since July. Sentiment among advisory services (shown here) was little-changed this week, but bulls continue to outnumber bears by more than 20% (46% to 23%). A spread closer to 10% would suggest optimism has been washed out.
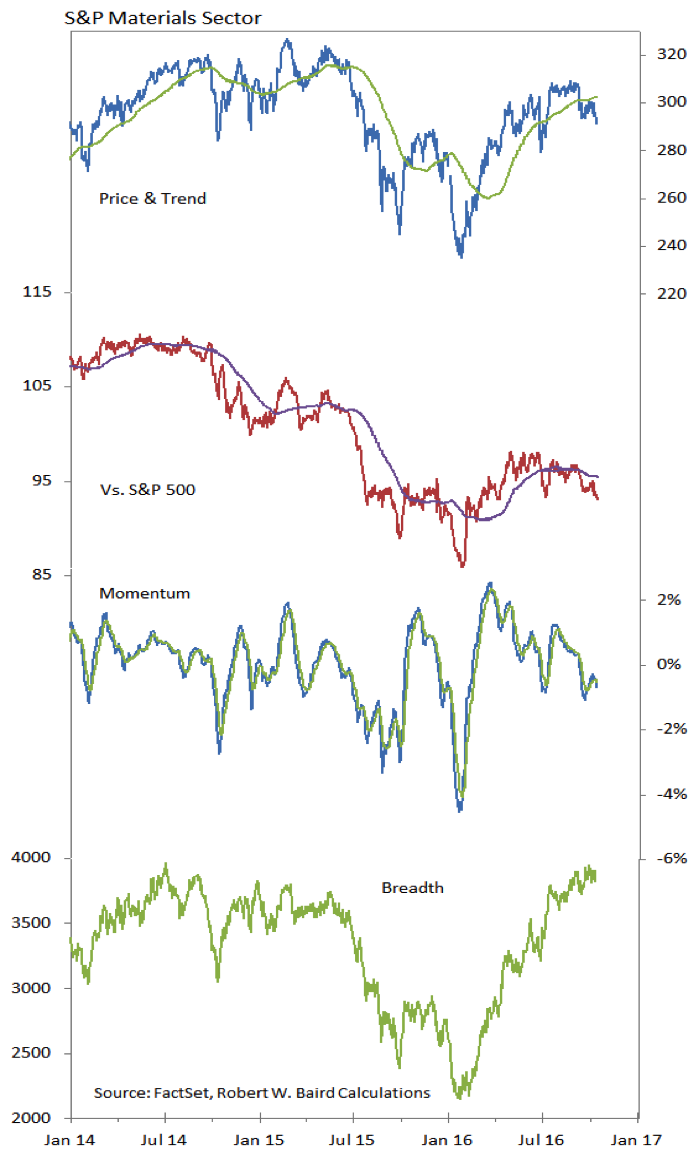
S&P Materials Sector
Materials have moved all over our relative strength rankings lately, occupying both the second-highest and second-lowest rankings at different points in September. They are currently just outside the leadership group, but the price, breadth and momentum trends suggest the sector could be set to slip again. On both an absolute and relative basis, price has undercut its previous lows. In the case of the relative price trend, this comes after failing to move through down-trend resistance. Momentum is moving lower again and breadth is struggling to remain above its trend.
Thanks for reading.
Twitter: @WillieDelwiche
Any opinions expressed herein are solely those of the author, and do not in any way represent the views or opinions of any other person or entity.


