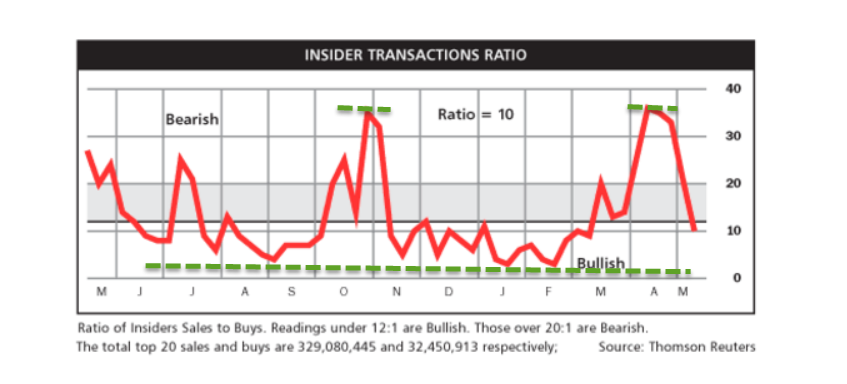
INSIDER TRANSACTION RATIO:
There have been notable outflows in funds and the Insider Transaction Ratio reflects the same. It is now coming into the spot (Ratio=10) or near that where there has often been inflows.
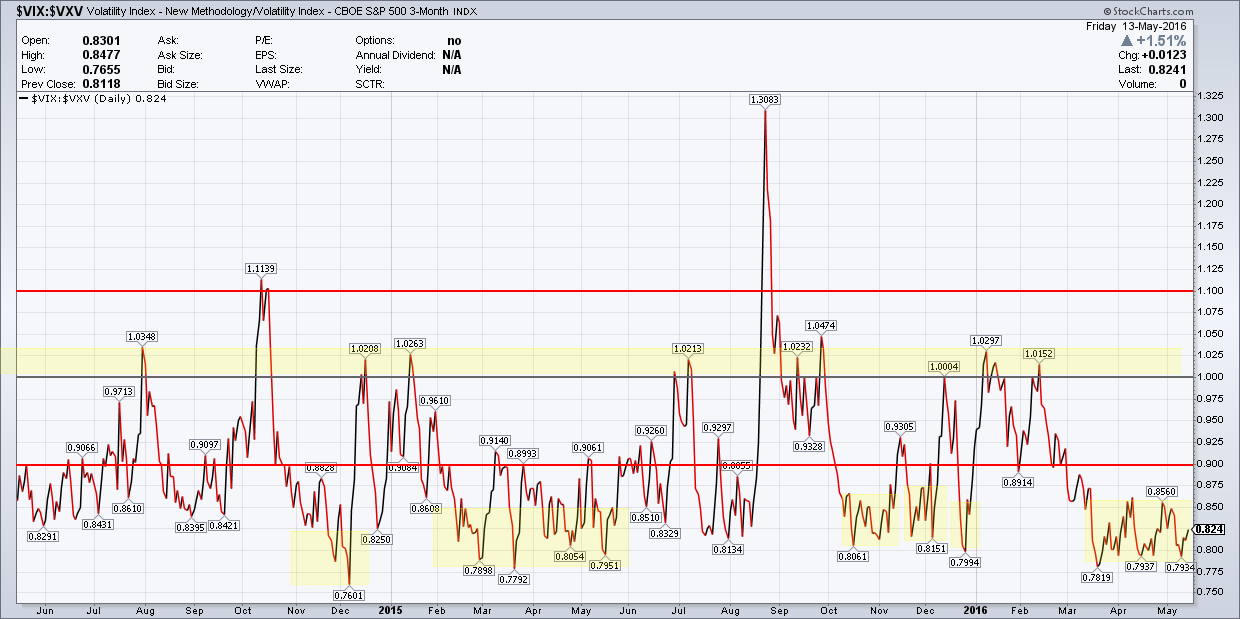
$VIX:$VXV:
$VXV is the 3 month volatility index. The relationship between $VXV and $VIX (30 day volatility) or the ratio between them if > 1.00 often spells trouble for equities. This ratio did turn up last week a bit and finished at 0.824 but still in the lower zone. Unless this over 0.90-1.00, not much to look for in terms of volatility other than it being range bound.
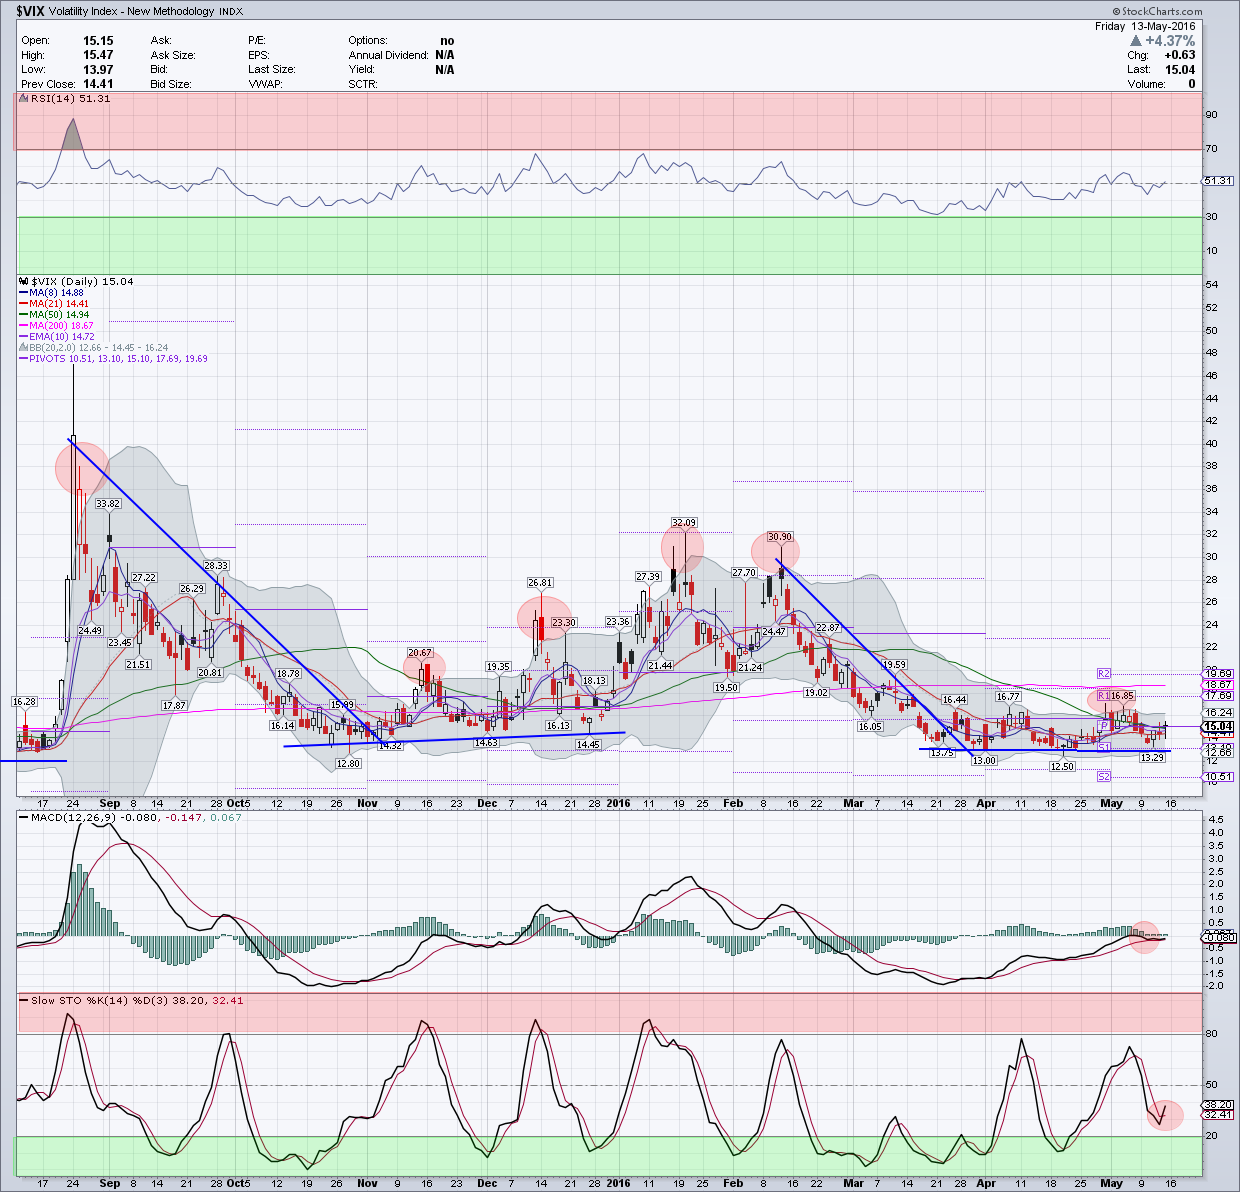
$VIX – CBOE VOLATILITY INDEX – (DAILY TIMEFRAME):
Last week, all that $VIX did was to move over the 21SMA and back down in a very contained range. Unless over 18 or 22, expect $VIX to be within the lower end of the range. The momentum indicators on this timeframe are neutral with RSI trying to rise over median while MACD is flat.
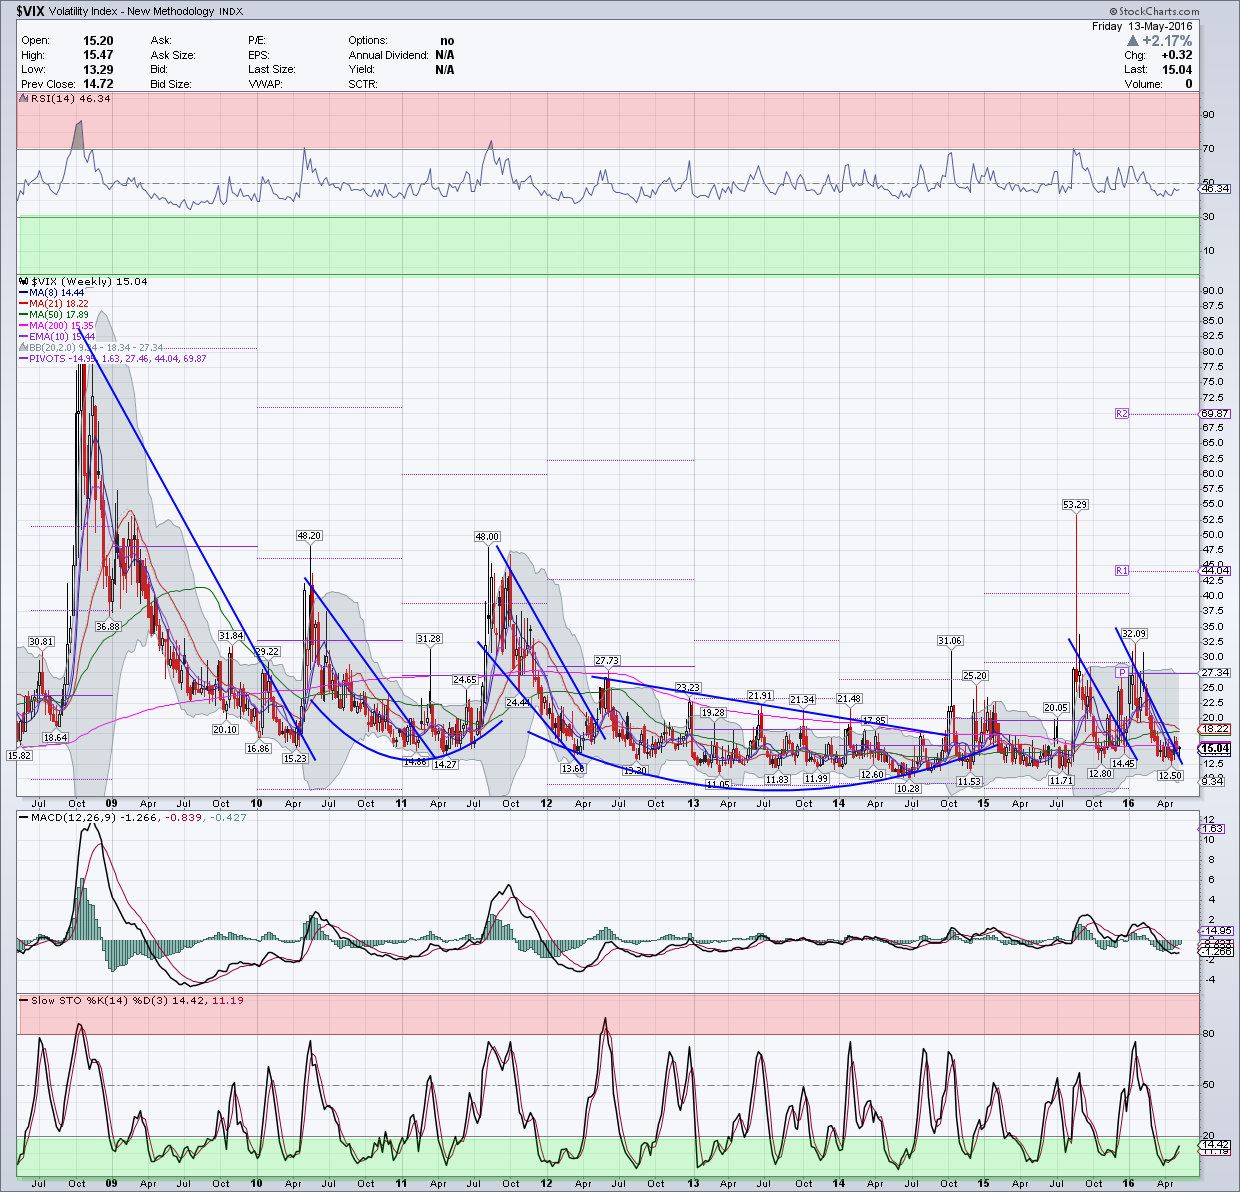
$VIX – CBOE VOLATILITY INDEX – (WEEKLY TIMEFRAME):
On the weekly timeframe, $VIX has done a whole lot of nothing staying below the MA congestion. Both RSI and MACD are flat on this timeframe suggesting that it will be range bound but contained.
Resistance: 15.67, 18, 22, 24, 30, 31, 35, 43, 44, 55, 80. Support: 12.40, 10.00, 8.60
$SPY – DAILY TIMEFRAME:
On the Daily timeframe, $SPY moved higher Monday and gapped up on Tuesday over its 21 SMA. However on Wednesday, it started turning back lower below the 21 SMA. On Thursday after testing the 50 SMA, $SPY bounced back higher but stalled right below the 21 SMA and Friday it continued lower below the 50 SMA. While price is less than 205, it didn’t close below prior week’s low which is now the near term support. There is a potential Head & Shoulders pattern with the right shoulder still being formed to get many excited. The measured move of this if it pans out will be around 196.84. This can be negated with a move higher over 208.54-209.
From a momentum indicator standpoint, RSI is falling and now below median while MACD continues to drift lower. Bollinger Bands are opening downwards as well. These support more downside or pullback in the short term.
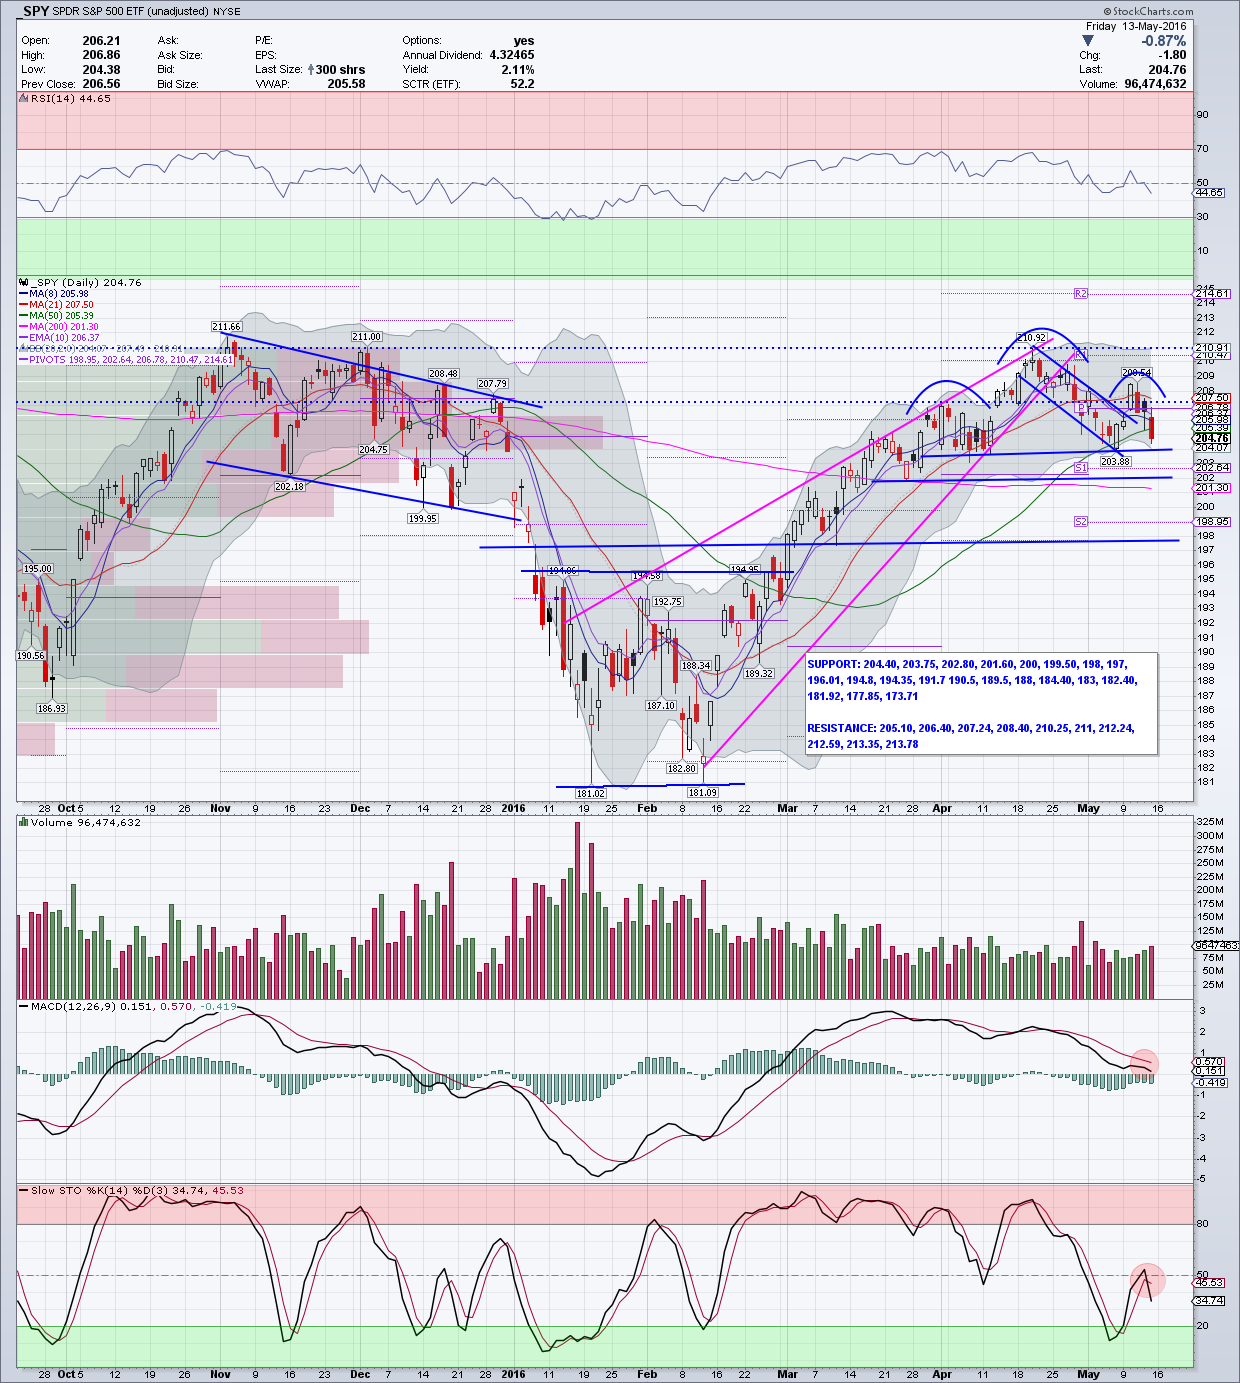
$SPY – WEEKLY TIMEFRAME:
On the weekly timeframe, $SPY is still in a bull flag but the weekly candle last week adds some sourness to the price action. However, RSI is still over the median declining mildly as though this is more like a digestion while MACD may be trying to turn lower. So far this suggestions potential consolidation on this timeframe to continue with some more pullback as a possibility.
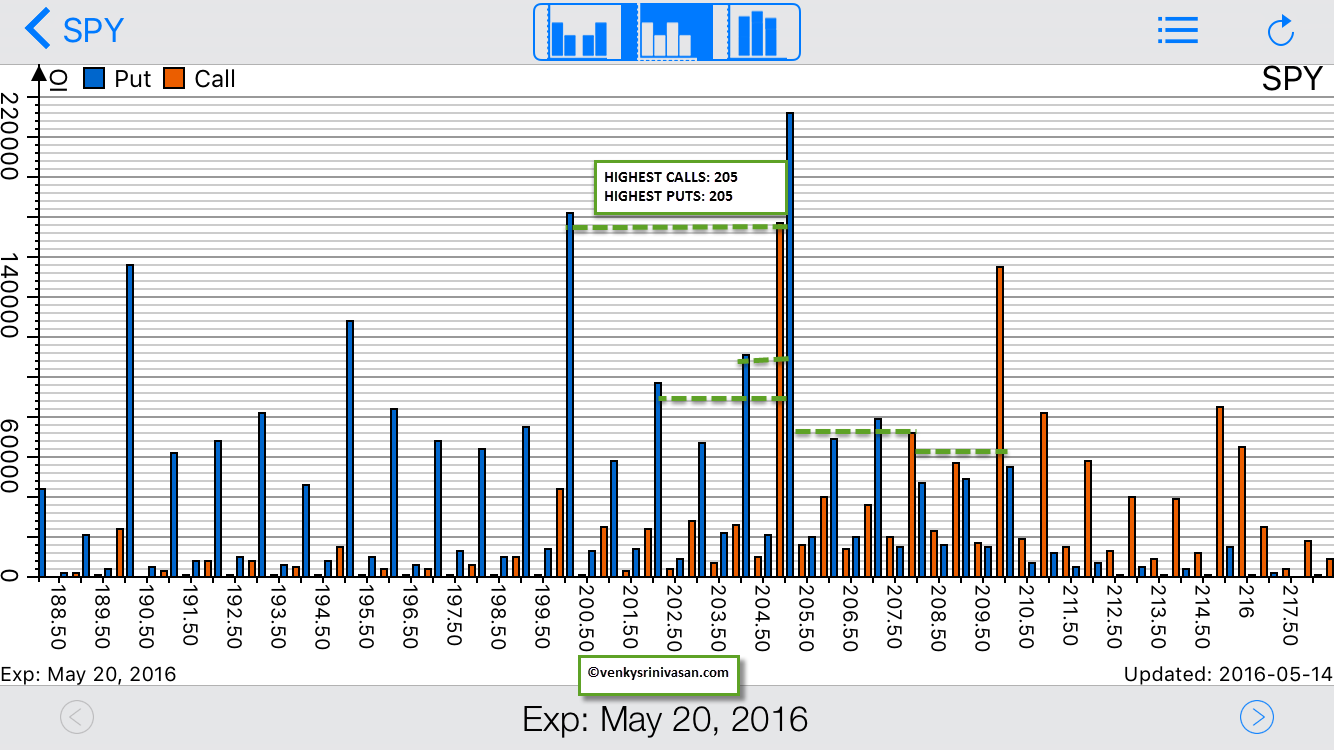
$SPY – OPEN INTEREST:
HIGHEST CALLS: 205
HIGHEST PUTS: 205
SCENARIOS:
With $SPY closing below 205 and with the highest number of calls and puts at that strike, that ought to be the battle ground for both bulls and bears and a potential pin zone if the tug-of-war ends there this week.
- If $SPY gets over 205, the first resistance will be at 207 and if price gets over that, $SPY can see 208. A failure anywhere in between or between 208.40-208.54, high chances for $SPY to see 205 again in the week.
- If $SPY continues lower early on in the week, 204 will be the first support both on the charts and via open interest. Below that, 203, 202 then 200 are big support zones and a potential for price to move there is high if $SPY cannot go over 205 for the entire week.
- An uber bullish scenario is where price goes over 205, retests 205 after visiting 207/208 and moves over 208 again to see 210. I will not rule out this option with any favorable reaction to some positive comments in the FOMC meeting minutes.
- As a worst case scenario, a big bearish move below 200 to visit lower prices from 199-195 with 196.84 being the measured move of the Head & Shoulders pattern that many are looking at.
WRAP UP:
Overall, this seems to be a controlled pullback in the short term with contained volatility after a humungous move higher from the lows. The intermediate and longer term outlook still remains bullish. One can expect more choppy action for now. If uncomfortable with this choppy action, less is more and cash may be a position.
Thank you for reading. Have a wonderful trading week.
Twitter: @sssvenky
The author has positions in mentioned and related securities. Any opinions expressed herein are solely those of the author, and do not in any way represent the views or opinions of any other person or entity.
")


")
