A LOOK AHEAD FOR MAY OPTIONS EXPIRATION (OPEX)
It’s been a very tricky market tape for bulls and bears over the past couple of weeks. Bulls have been unable to press the stock market above resistance, while bears have been trying hard to break bigger support levels but in vain. A lot of sectors are breaking down, momentum and breadth is waning, and global issues especially with the so called “BREXIT” vote are looming in current and future headlines/news.
There are many calls for “Sell In May and Go Away”. Consolidation/Digestion occurs either via price or time. While the short term action is choppy/range-bound, all that the stock market indices have managed to do so far is to pullback 2-3% after a mammoth 11-12% rally higher.
The S&P 500 will be the focus today but we’ll hit up on several key stock market indicators, while touching on sectors and indices.
U.S. ECONOMIC REPORTS:
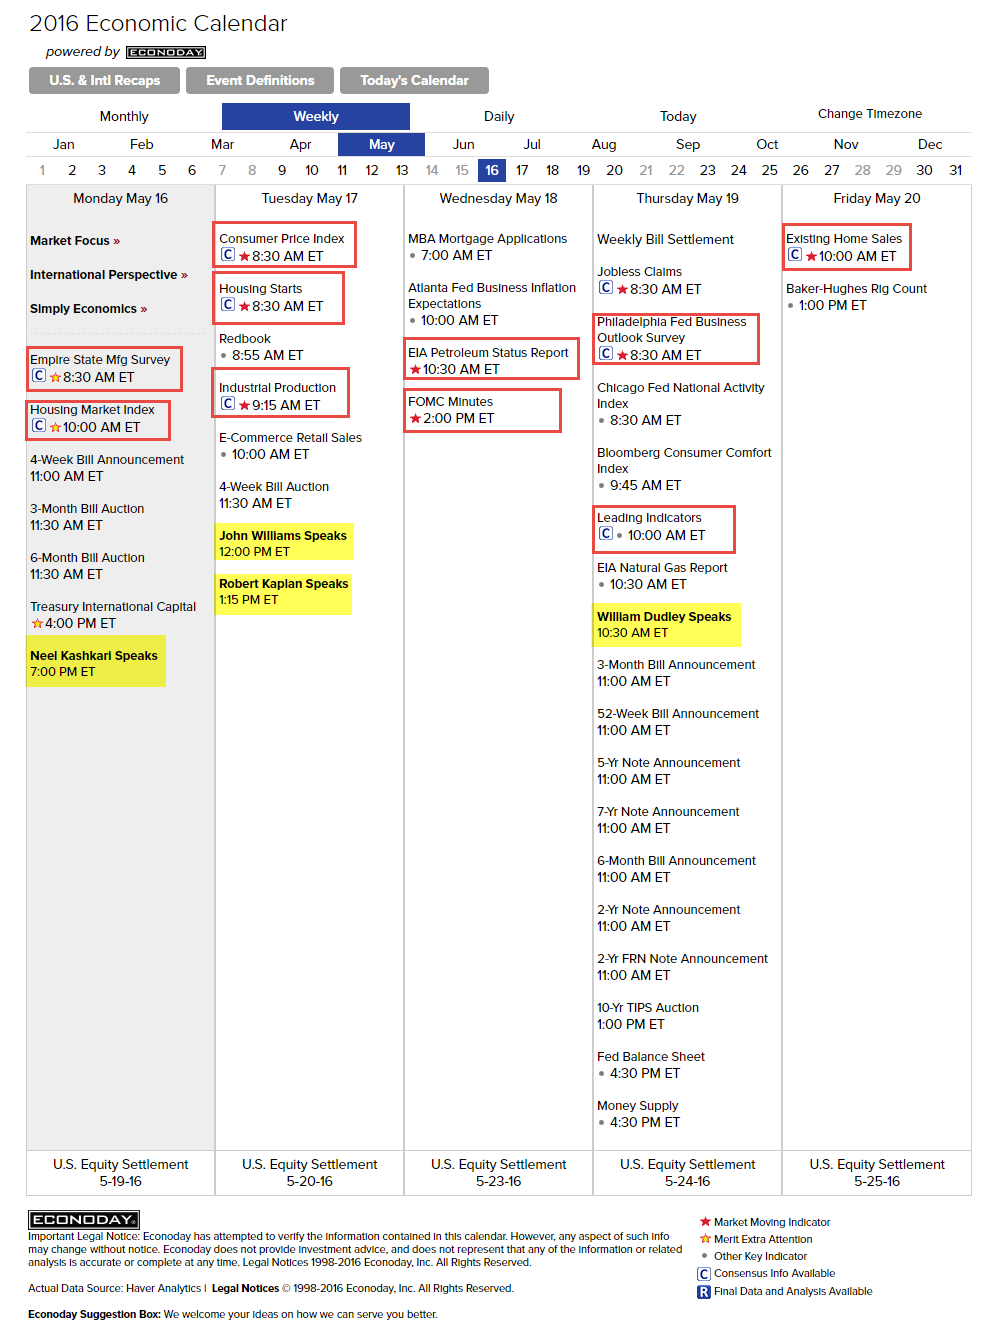
There are quite a few Economic Reports next week and all eyes are on the FOMC meeting minutes on Wednesday at 2:00 P.M. A lot is being talked about whether or not Fed will raise interest rates again this year or not plus recent talks of Negative Interest Rates as well (NIRP). One has to been wary about NIRP as those effects are seen in Japan. Other reports of interest are Empire State Mfg Survey and Housing Market Index on Monday, Consumer Price Index, Housing Starts and Industrial Production on Tuesday, Leading Indicators on Thursday and Existing Home Sales on Friday. Overall, it seems to be a busy week with respect to Economic reports. Additionally, there are representatives from Fed who will also be on tap this week.
EARNINGS REPORT:
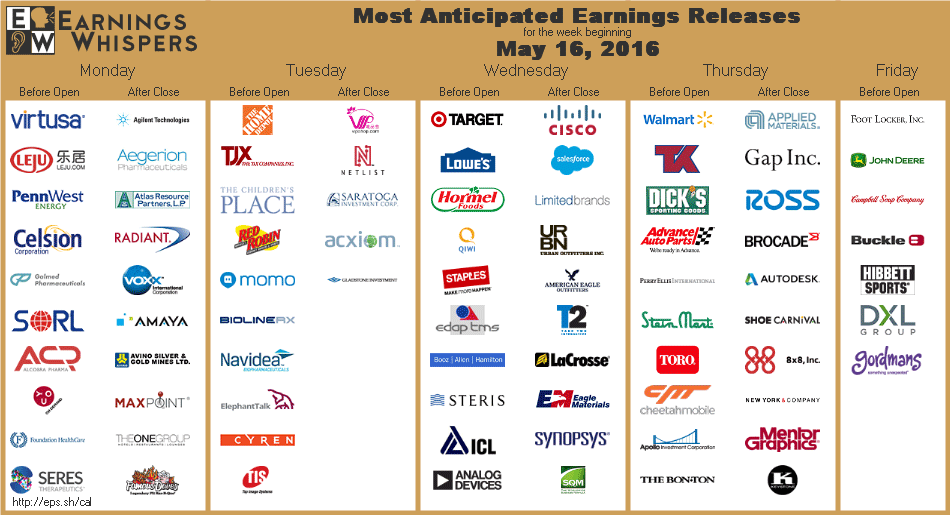
Earnings Season is coming to an end and investors are trying to digest a mixed bag of good and bad. Here are some key stocks reporting earnings this week:
MONDAY: $LEJU, $A
TUESDAY: $HD, $TJX, $PLCE, $RRGB, $MOMO
WEDNESDAY: $TGT, $CSCO, $CRM, $LOW, $SPLS, $ADI, $LB
THURSDAY: $WMT, $DKS, $GPS $AMAT, $AAP, $BRCD, $EGHT, $ROSS
FRIDAY: $DE, $FL, $CBP
MARKET BREADTH & SENTIMENT INDICATORS:
From a Market Breadth Indicator standpoint, here are few you should take a look at:
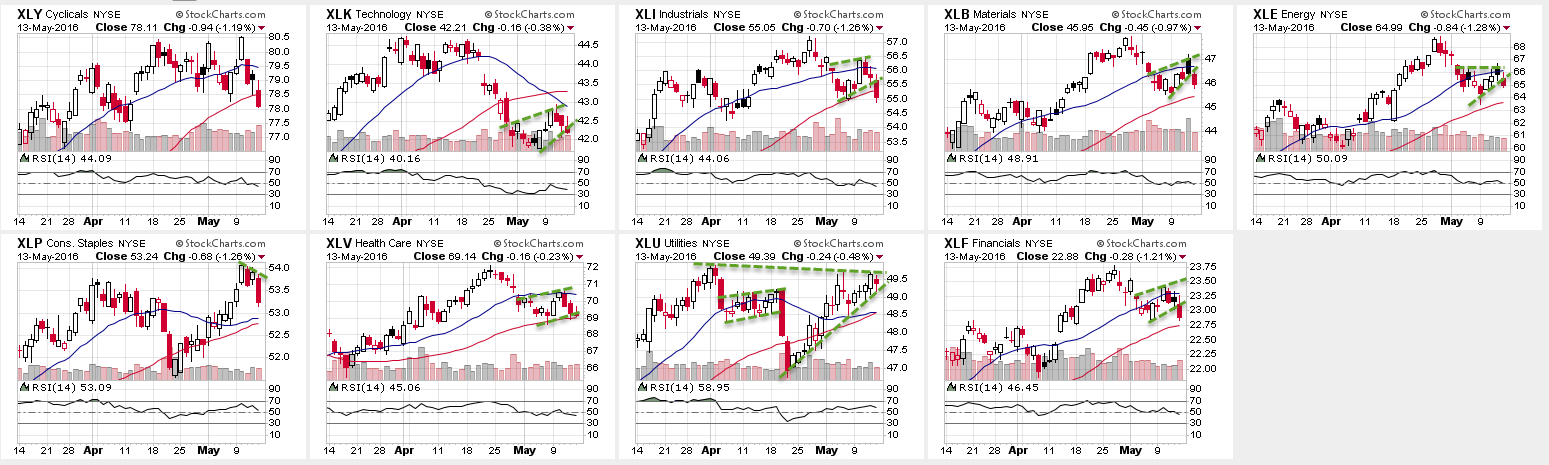
SECTOR PERFORMANCE: CANDLESTICK GLANCE
From a stock market sector standpoint, defensive sector such as Utilities ($XLU) stands out the most. Basic Materials ($XLB) and Energy ($XLE) don’t look shabby. All others took a hit last week. The laggards mainly have been Technologies ($XLK) although they fared slightly better on Friday. Despite some sizeable moves in Financials ($XLF) in the prior week or two, they are still weak.
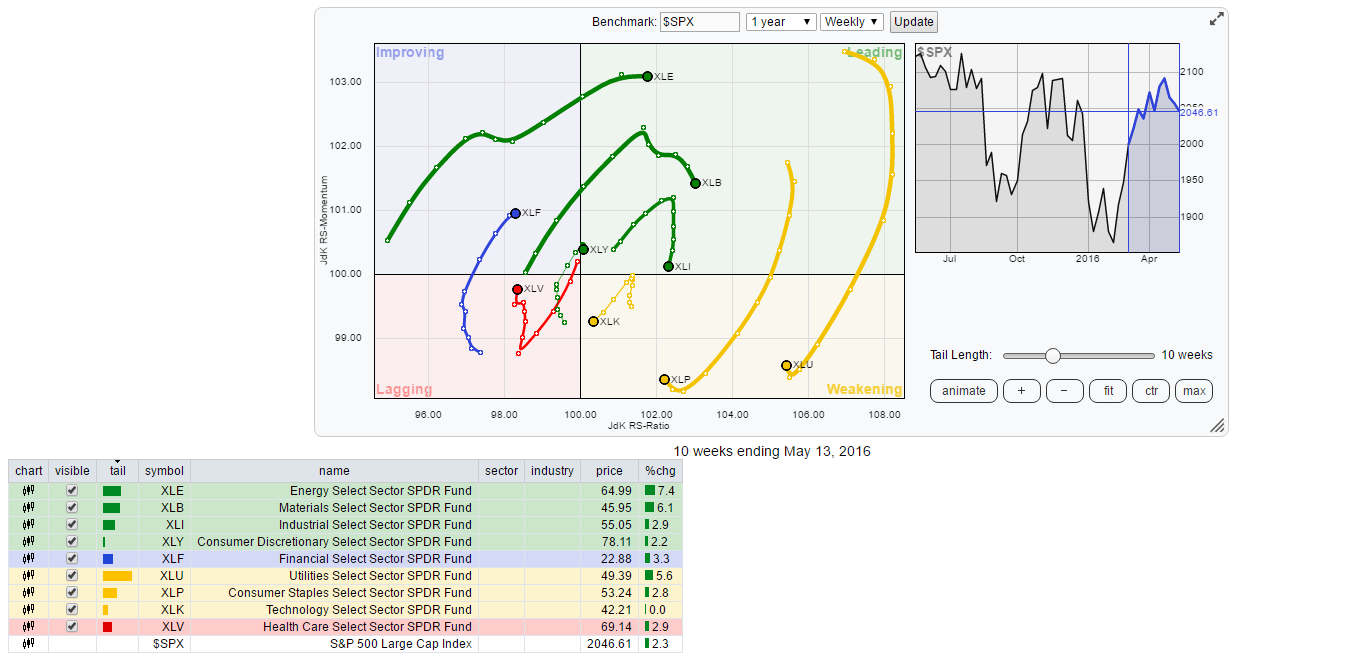
The Relative Rotation Graph (RRG) chart showing the leaders and the laggards among the 9 sectors.
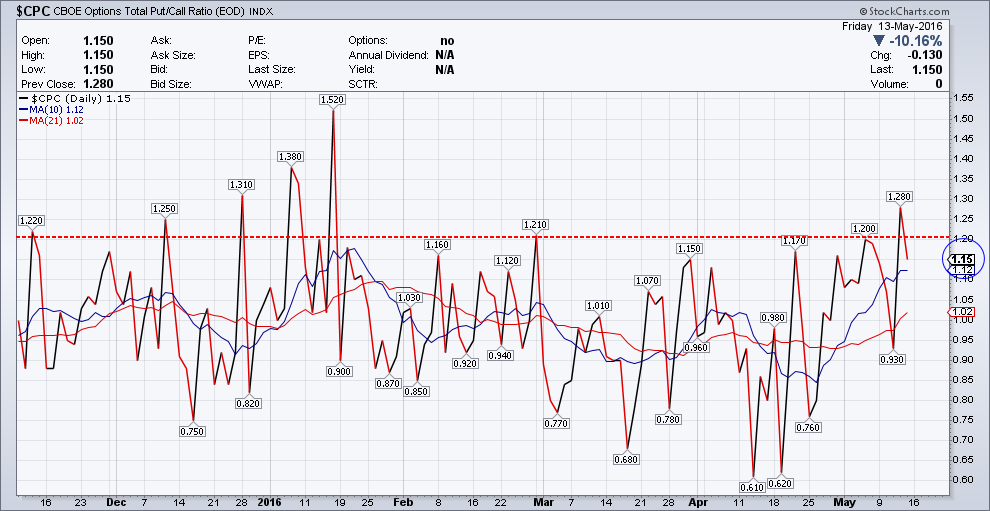
$CPC – CBOE Options Total Put/Call Ratio:
$CPC spiked to 1.28 but then pulled back on Friday. This shows that there is fear stepping into the market (not reflected in $VIX) and market participants are buying puts for protection. While 1.28 reading is high enough, it certainly has more room higher and that can signal an interim capitulation type low for the indices.
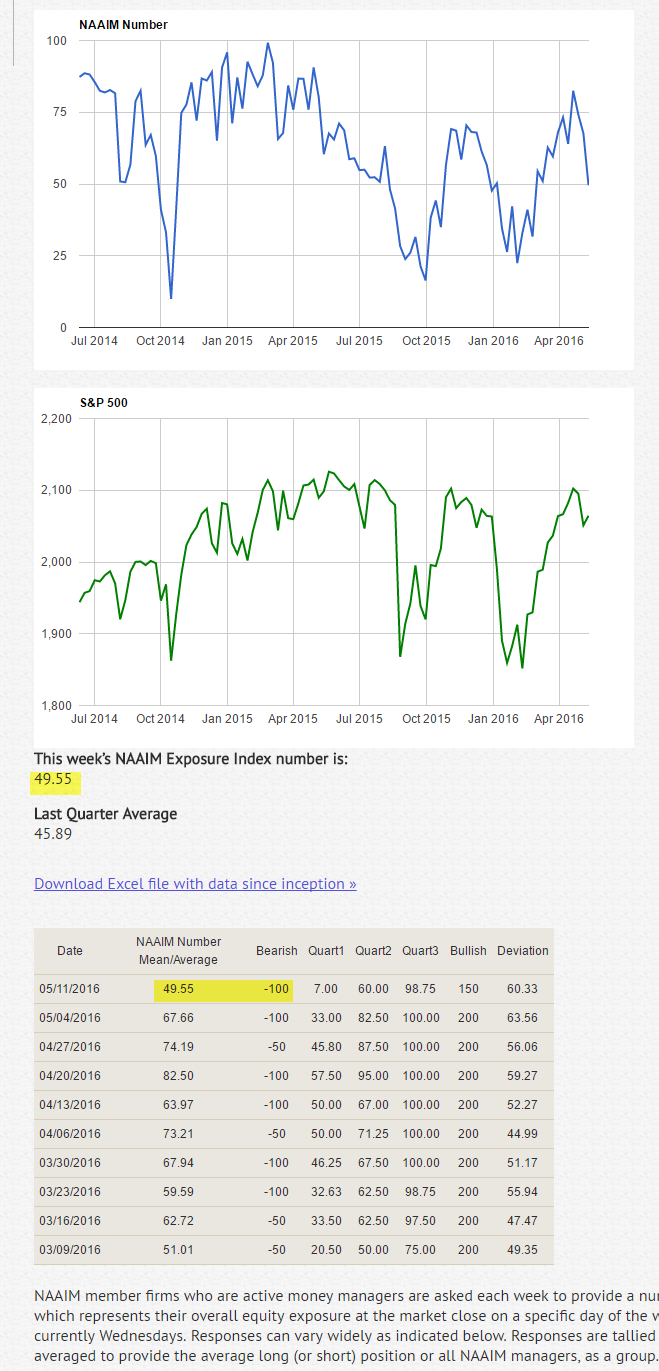
NAIIM EXPOSURE INDEX:
The NAAIM Exposure Index represents the average exposure to US Equity markets. The green line shows the close of the S&P 500 Total Return Index on the survey date. The blue line depicts a two-week moving average of the NAAIM managers’ responses.
The NAIIM Exposure Index was down to 49.55. It was above 80 just 3 weeks ago. This indicates that the active money managers are slowly but steadily not participating in the market. A reading of 36 or lower will be ideal for a sustained move higher in indices with room for these money managers to put money back to work.
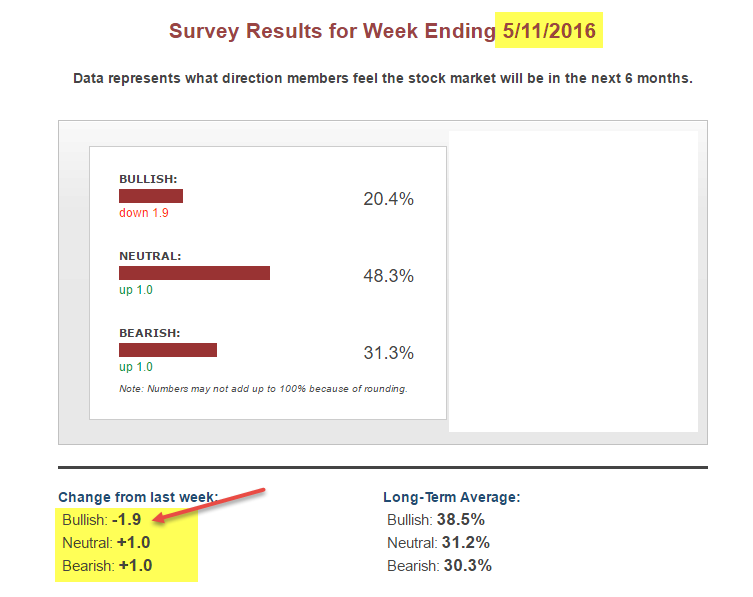
AAII INVESTOR SENTIMENT SURVEY:
AAII Survey ending 5/11/2016 shows that there are more bears than bulls. This is 3rd week in a row that the bears outnumber bulls.
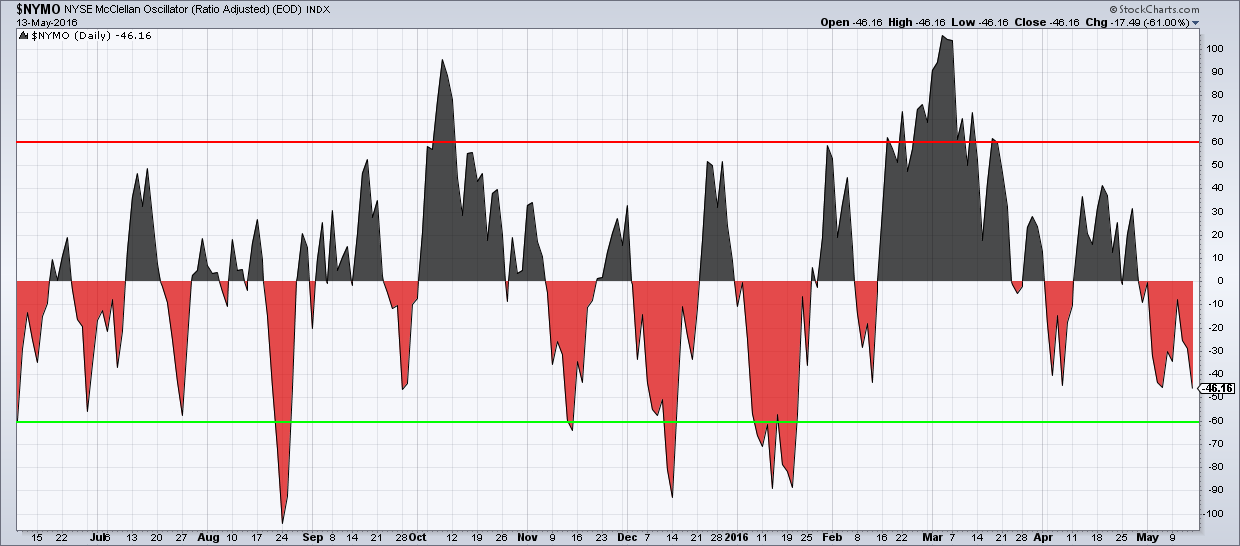
$NYMO (MCCLELLAN OSCILLATOR):
$NYMO finished the week at negative 46.16. Both breadth and momentum are waning and are negative as of now. $NYMO has room lower (-60 or lesser) before being oversold.
continue reading on the next page…
")


")
