S&P 500 Trading Outlook (3-5 Days): Bearish
The break of 2831 was the first negative, but XLK, XLF violating support along with Crude oil and Bond yields looks to be a larger negative for the next 3-5 days.
Expect a test of 2800 sooner than later with a breakdown leading to 2762 initially, followed by the very important 2732-4 level.
At the same time, regaining 2869 is important for bulls if they wish to negate this bearish skew.
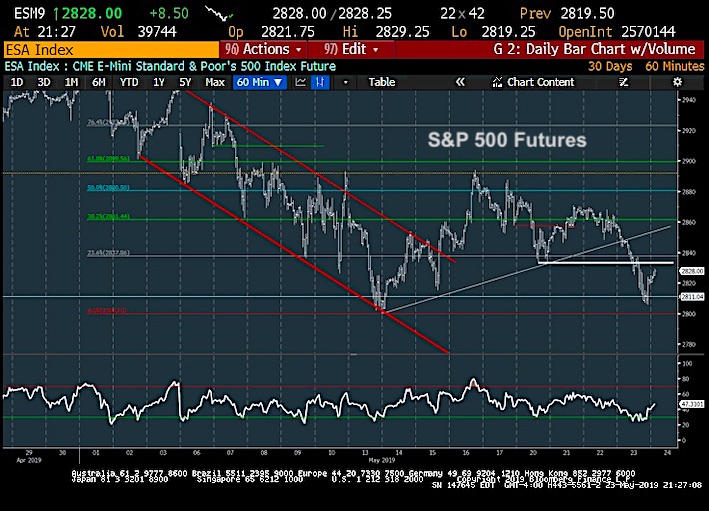
S&P 500 Chart – Technical Analysis
Yesterday was very important, technically. Not only did S&P get under Monday’s 2831 low, but did so on expanding negative breadth (-4/1) and volume, something which hadn’t happened over the last couple weeks, outside of early May right at the peak. S&P 500 ETF (SPY) volume finished DOUBLE the level from Wednesday, at 98.6 million, easily the highest of the week, and nearly as high as last Friday’s 100.3mm Expiration total.
The S&P 500, Dow Jones Industrial Average, NASDAQ and other benchmark indices have deteriorated down to important price areas near the mid-May lows.
Another negative for the broader market is Crude oil’s break down. Crude Oil violated $60 while pulling back over 5% for the day (a very steep decline). This caused a huge amount of underperformance in the already suffering Energy sector.
The decline in WTI Crude Oil is important, given that Crude Oil and the S&P 500 both peaked on 10/3/18, bottomed on 12/24/18, and then peaked again in late April. Crude Oil’s peak last month occurred right as the NDX, CCMP and TRAN peaked on 4/24. The positive correlation of late between Crude Oil and Equities cannot be denied. Now the sudden huge underperformance should certainly “raise eyebrows” at a minimum, but points to a very good likelihood of additional losses, not only for WTI Crude but also for the downtrodden Energy sector.
Also notable is that the US 10-year Treasury yield snapped the lows made on March 28 (2.338%), and fell quickly to 2.30% before finishing the day at 2.3185. This close was UNDER both the March and mid-May lows.
The Bottom line: After 5 days of range-bound trading with S&P less than 5 points away from where it had closed the week prior, yesterday seemed to be the straw that broke the camels back, and happened on a multi-asset class breakdown. Until/unless this can be immediately recouped, this would seem to tilt the odds towards additional selling into month- end.
The two key cycle dates hit at end of month and then mid-June, near 6/13-16. If fear can start to build rapidly, then it’s likely that equity selling might be over by end of month. For now, the S&P 500 has come full circle and round-tripped to within striking distance of a very important area at 2800 that looks to be challenged in the next few days. Neutral trends have turned bearish, and it’s right to position in XLP, XLU and XLV and avoid Tech, Industrials, Financials, Discretionary until stocks can stabilize.
If you have an interest in seeing timely intra-day market updates on my private twitter feed, please follow @NewtonAdvisors. Also, feel free to send me an email at info@newtonadvisor.com regarding how my Technical work can add alpha to your portfolio management process.
Twitter: @MarkNewtonCMT
Author has positions in mentioned securities at the time of publication. Any opinions expressed herein are solely those of the author, and do not in any way represent the views or opinions of any other person or entity.


