Key Stock Market Takeaways:
New price highs at the index level have come on deteriorating momentum.
Weakening broad market trends and an expansion in the new lows list would be signals that risks are rising.
Equity fund outflows have been evidence of investor caution – inflows would signal a higher risk sentiment backdrop.
Last week’s commentary – Looking For Evidence That Risks Are Ebbing – focused on what developments might be seen if market risks were ebbing. This week the focus will be on evidence that would suggest that risks not only are not ebbing but actually building and pointing to some deterioration.
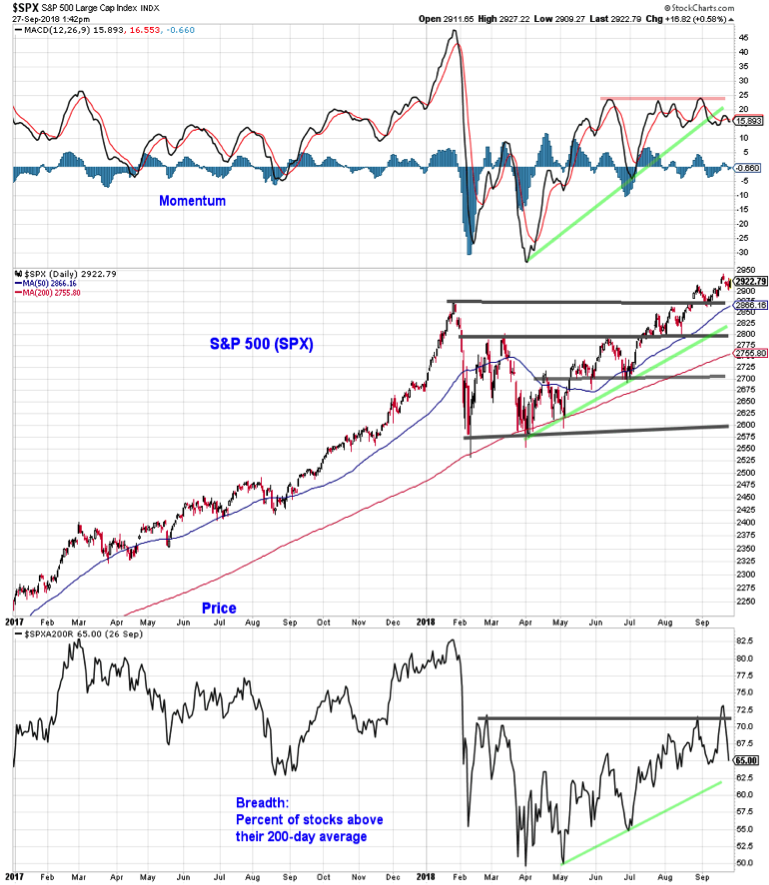
From the perspective of index-level developments, the S&P 500 is just below an all-time high, but price strength is not being confirmed by momentum. New price highs since mid-year were accompanied by a failure to see new momentum highs. The most recent price strength has come as momentum has not only failed to expand to the upside, but has actually broken down. Momentum weakness can likely be discounted if price stays strong. In that respect, holding above support near 2870 could be important.
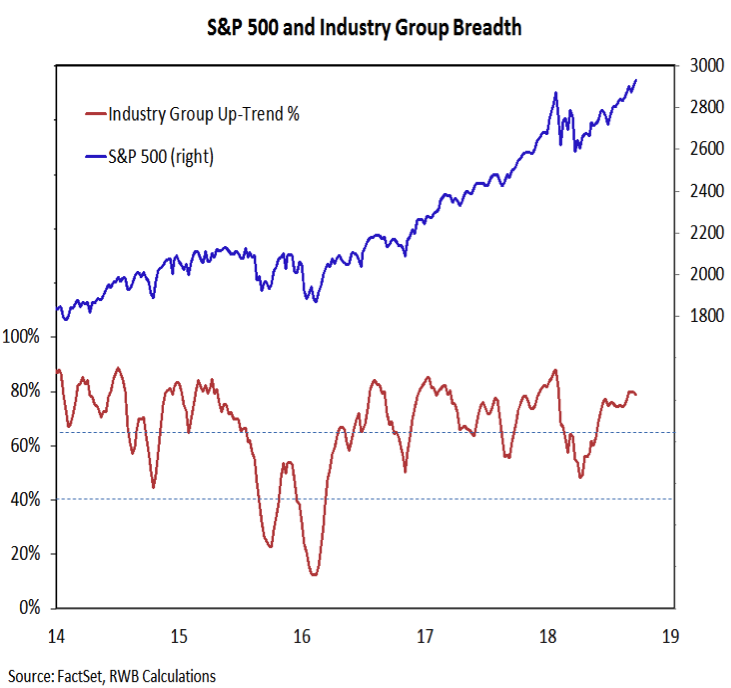
The performance of the broad market remains a key focus for either signaling strength (and the ebbing of risk) or showing signs of deterioration. Breadth generally has lagged the improvements seen at the level of the indexes this year. The percentage of industry groups in up-trends has expanded, but remains shy of its early-year peak. More recently, this indicator has stalled as the S&P 500 has moved to new highs. Deterioration from this point could be an important warning sign. Given that small- and mid-cap groups are represented within this indicator, such a deterioration would not be unexpected at this point.
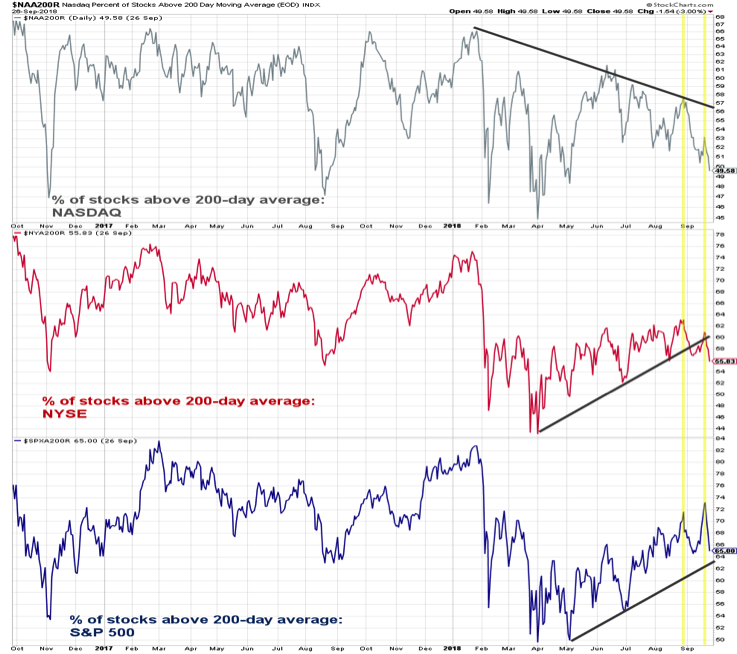
If the broad market was providing fuel for a rally, the expectation would be to see marked strength followed by consolidation in terms of the percentage of stocks trading above their 200-day averages. Instead we have seen hard fought gains followed by quick pullbacks once the indexes stop moving higher. While the percentage of stocks in the S&P 500 has been making higher highs and higher lows, the same cannot be said in terms of breadth on the NASDAQ or NYSE. The most recent highs for the S&P 500 came on lower highs (followed by lower lows) on the NYSE and NASDAQ. A breakdown in the percentage of S&P 500 stocks trading above their 200-day average (below 63%) could be a negative development for the index.
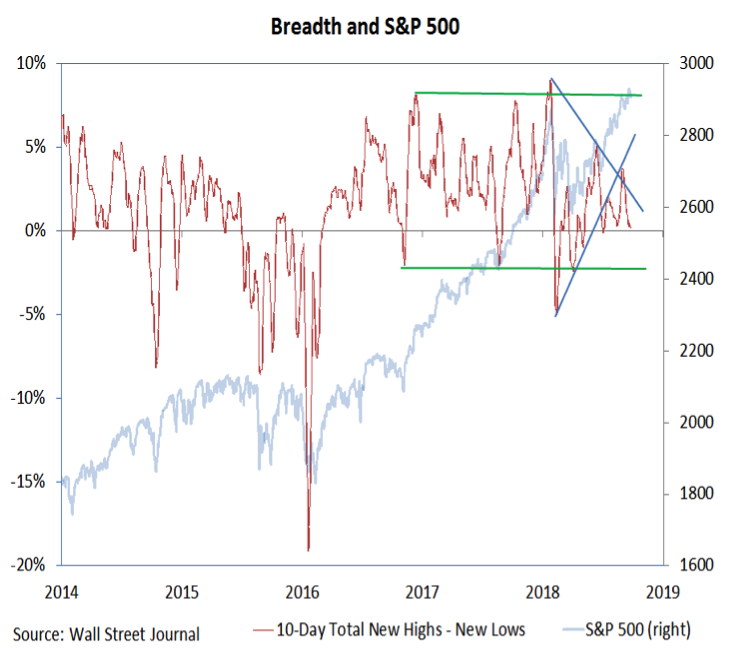
An expansion in the number of stocks making new lows would also be an indication of increased risk for the S&P 500. A lack of new highs cast doubt on the strength of rallies. But if conditions on the indexes are meaningfully deteriorating, we need to look past the absence of new highs and be on alert for an expansion in the new low list. Looking across both the NYSE and NASDAQ, new highs and new lows have been roughly equal.
There are many sentiment indicators (surveys from Investors Intelligence and NAAIM come to mind) that suggest investors are fully invested and optimism is running high. The counter to that comes from the fund flow data, which points to continued outflows from equity funds. Stocks have historically done well when investors are scared enough to shift funds away from equities. On the other hand, evidence of inflows to equity funds would signal investor optimism and would, from a contrarian perspective, be a warning that risks have risen.
Twitter: @WillieDelwiche
Any opinions expressed herein are solely those of the author, and do not in any way represent the views or opinions of any other person or entity.


