Stock market volatility emerged this week after internal measures failed to show confirmation of the rally on a broader basis. This could keep the stocks rangebound for the week ahead.
In today’s stock market outlook we’ll look at the S&P 500 technical backdrop and current market breadth indicators for the week ending March 2, 2018.
Key Takeaways: The rally off of the February lows seems to have run out of steam with both price and momentum on the S&P 500 faltering. The bounce at the index-level failed to clear the downside momentum that has emerged in the broad market. While stock and sector-level trends have bounced, they have not made meaningful upside progress.
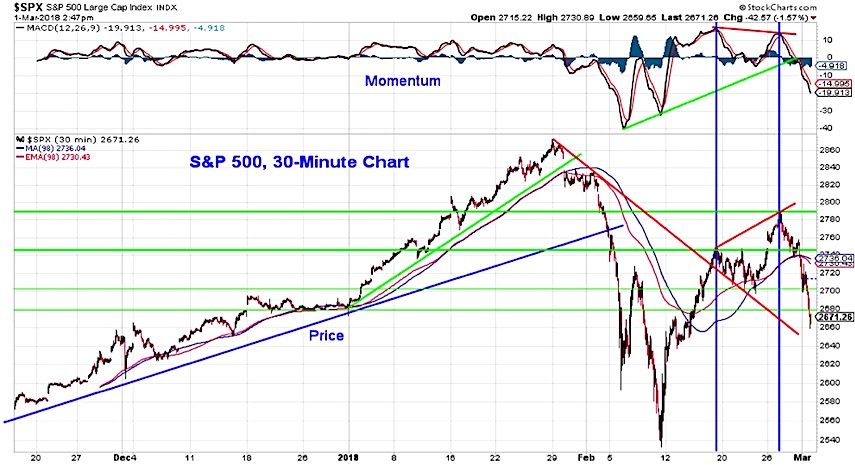
S&P 500 Index
While the S&P 500 continued to recover early this week (following up Friday’s 1% gain with another 1% gain on Monday, the 11th and 12th moves of at least 1% seen in 2018), momentum was not able to confirm these new prices highs. Since then, the S&P 500 has posted three consecutive declines of more than 1%. Near-term momentum has now broken the up-trend that emerged off of the February lows and the S&P 500 is trying to find support in the 2640-2680 area.
Looking beyond the uptick in volatility that is likely to be a persistent theme this year, we are seeing a lack of confirmation from the broad market.
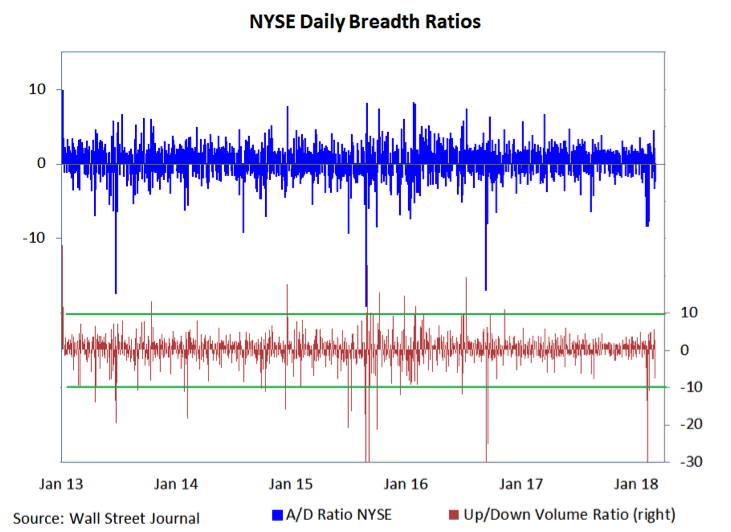
Over the past 5 trading days, however, the S&P 1500 averaged 100 more declining issues than advancing issues. Until Wednesday, the major stock indexes had been holding up better than the broad market.This is a sign of narrowing rally participation and could leave the indexes vulnerable as talk of a re-test of the February lows increases.
After seeing multiple days of downside volume outpacing upside volume by more than 9-to-1 as stocks worked lower in early February, we have been looking for at least two days with upside volume outpacing downside volume by at least that margin to signal that downside momentum had been reversed. The best we have seen so far was slightly more than 5-to-1 upside versus downside volume on Friday. From this perspective it is hard to conclude that downside momentum has been staunched.
In addition to single-day volume thrusts, we have looked for evidence of a sustained advance in the broad market. To do this, we have monitored the 10-day advance/decline ratio (moving from measuring volume flows to looking at the number of stocks advancing or declining). In the past, when this measure has surpassed 1.9% it has signaled a “breadth thrust” that indicates upside momentum has emerged in the broad market. The track record of this indicator speaks for itself in terms of suggesting tailwinds for stocks that last for up to a year after such signals. In the current episode, this indicator peaked at 1.8 on Monday and has retreated as selling emerged this week. While the index-level rally off of the lows was strong, the broad market gains have been insufficient to suggest upside momentum is building.
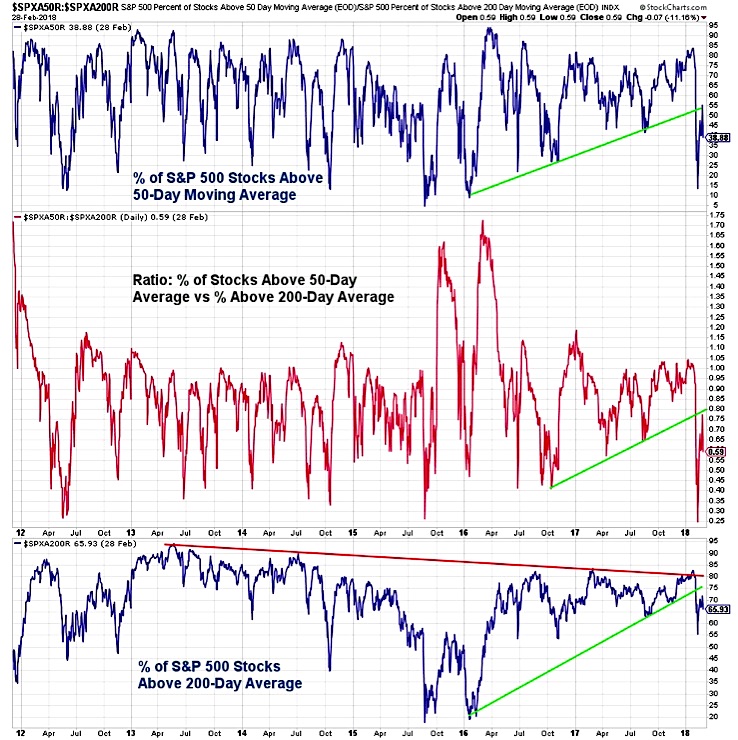
Further evidence of a lack of follow though comes from the percentage of stocks trading above their 50-day averages and the percentage trading above their 200-day averages (as well as the ratio between these two indicators). In each case, we have seen a bounce off of the February lows, but an inability to get back above the trend lines that were violated during the selling. The failure of these indicators to get back in gear suggests a re-test of their February lows may be seen. From a longer-term perspective, renewed weakness in the percentage of stocks trading above their 200-day averages (especially undercutting the February low) would be a sign that broad market deterioration is becoming a more meaningful downside risk for the S&P 500 (as opposed to just not confirming a rally).
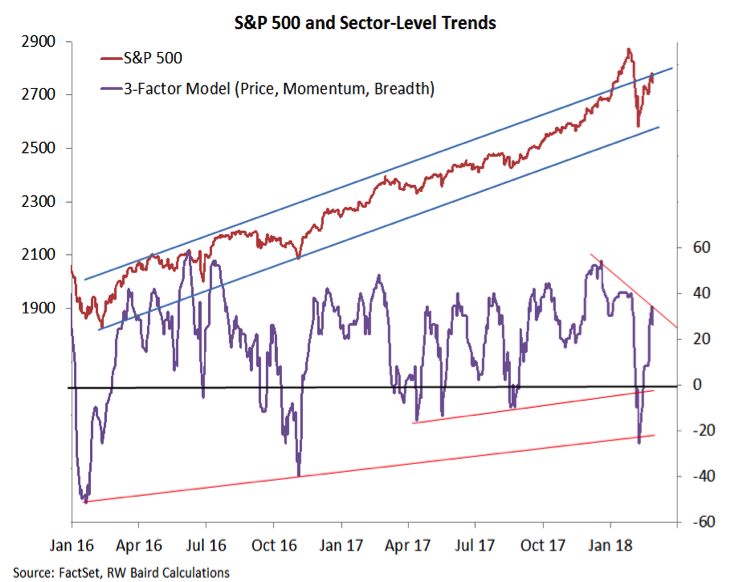
One area of modest encouragement has been the bounce back in sector-level trends. Here too, however, caution is warranted. This indicator has not broken its pattern of lower highs and has not led the improvement being seen in the S&P 500.
It is worth noting that this lack of broad market confirmation comes with sentiment indicators that have not signaled a meaningful up-tick in pessimism. This seems to set stocks up to continue to be volatile as we move through the first half of 2018.
Thanks for reading.
Twitter: @WillieDelwiche
Any opinions expressed herein are solely those of the author, and do not in any way represent the views or opinions of any other person or entity.
: Creating Bullish Divergence?")


 and Semiconductors (SMH): Concerning Price Pattern?")


