In this week’s investing research outlook, we analyze the technical setup of the S&P 500 Index (INDEXSP:.INX), key stock market trends and indicators, and discuss emerging themes and news that we are watching closely in our investing research.
Here’s a summary of our findings for the week ending June 23, 2017:
Looking for New Leaders – Heading toward the halfway point for 2017, the stock market is seeing some rotation as the search is on for new stock market leadership into Q3. European stocks have pulled back to support after being early leaders this year. Small-caps enjoy better momentum and price trends than large-caps (even though relative strength has favored large-caps). After a recent surge, Health Care is poised to overtake Tech as the top-performing sector for 2017.
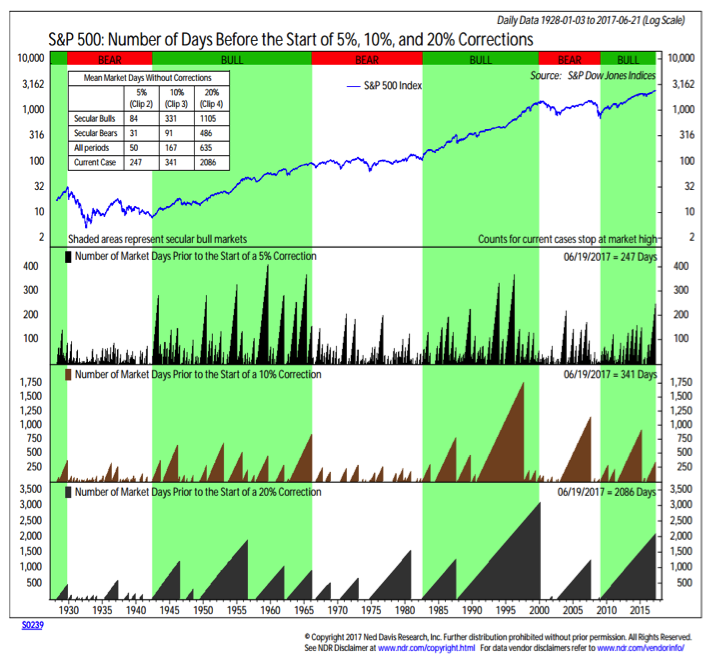
Calm Markets Add to Investor Complacency – There are multiple ways to describe the relative calm that stocks have seen in the first half of 2017: single-digit readings on the VIX, the second-smallest peak-to-trough first half decline for the S&P 500 on record or the 250 days since the last 5% pullback. The effect has been to leave investors relatively complacent.
Decline in Oil Could Be a Positive for Stocks – While transitioning leadership and elevated optimism could mean increased volatility for stocks in the second half of 2017, do not expect the recent drop in oil prices to necessarily precipitate weakness in stocks. In fact, declines in the dollar-adjusted price of oil have historically been quite bullish for stocks.
Stock Market Indicators:
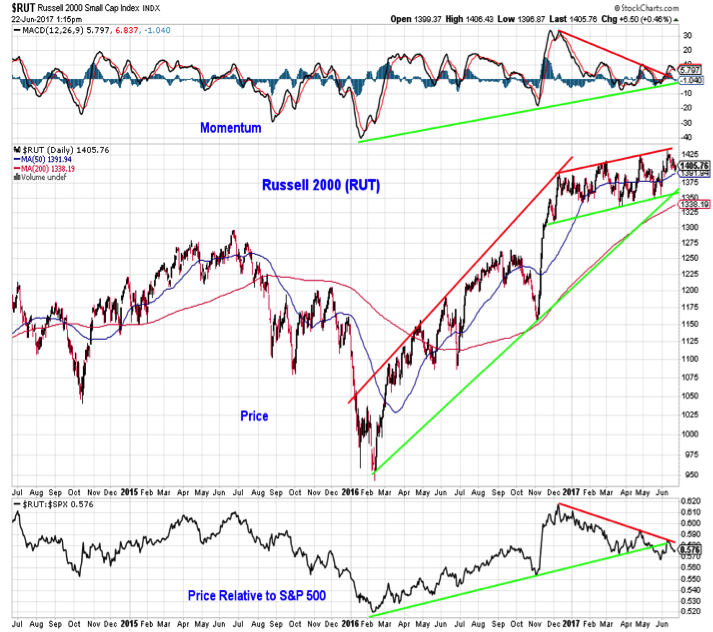
Russell 2000 Index
The small-cap Russell 2000 has lost relative strength versus large-caps over the course of 2017. Two attempts to re-assert relative leadership have not produced any follow-through. On an absolute basis, however, small-caps continue to trend higher on both and intermediate-term and longer-term basis. Focusing only on the relative price trend can obscure this strength. Moreover, the momentum trend remains higher (and in better shape than large-cap momentum). This could help support small-cap leadership in the second half of the year.
Historical Correction Insights
The 3.2% peak-to-trough decline in the S&P 500 in the first half of 2017 was the smallest such decline since 1995 and is the second smallest on record. The S&P 500 is now closing in on 250 days since the last 5% correction, which is the longest since the mid-1990s and is three times as long as the average in bull markets. The lack of volatility in the first half of 2017 has left investors comfortably optimistic, but this could sow the seeds of increased volatility in the second half.
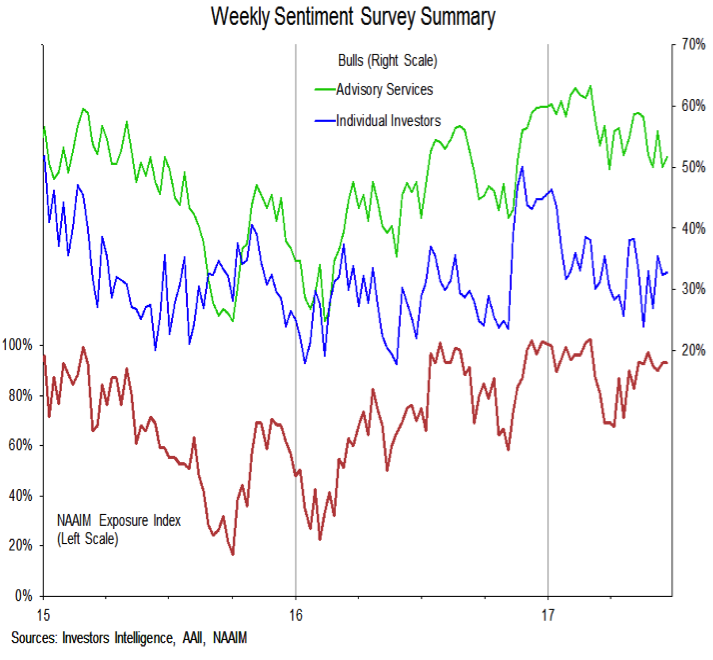
Investor Sentiment
This week’s sentiment surveys reveal this investor complacency. As a whole the surveys were little changed versus last week (in fact the NAAIM Exposure index was exactly the same, out to two decimal places). While not necessarily showing euphoria, there is certainly an absence of skepticism in these sentiment numbers. Fund flows from last week revealed increased optimism. According to ICI, equity funds attracted $27 billion in inflows ($20 billion of that was for domestic equities).
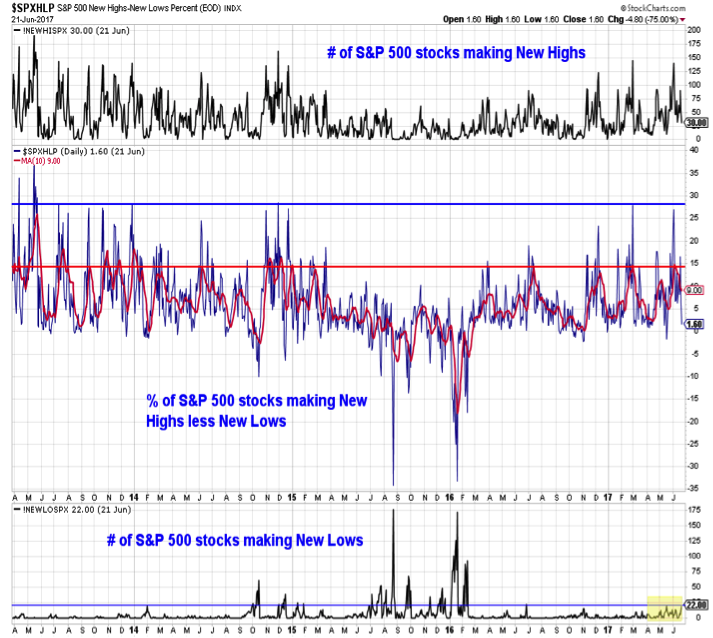
Market Breadth
Investor complacency could become especially problematic if breadth deteriorates. So far, breadth trends remain strong even as stock market leadership undergoes some rotation. This has left relative few areas of the market making new highs (from a sector perspective only Health Care and Industrials joined the S&P 500 in making new highs this week). If the lack of new highs persists, and the new low list (which has been dominated by Energy and Retail names) expands, it could suggest deterioration in the broad market that could take further consolidation to resolve.
continue reading this article on the next page…


")