Stocks continued their ascent this week but breadth and momentum concerns continue to linger.
In this week’s stock market outlook, we’ll take a closer look at the S&P 500 (NYSEARCA: SPY) and global market backdrop.
Key Takeaways:
Index-level price gains are unconfirmed by momentum or breadth strength.
Stocks tend to struggle ahead of mid-term elections, especially in the face of external catalysts.
The global backdrop is becoming more challenging. Sentiment remains mixed across indicators.
S&P 500 Index
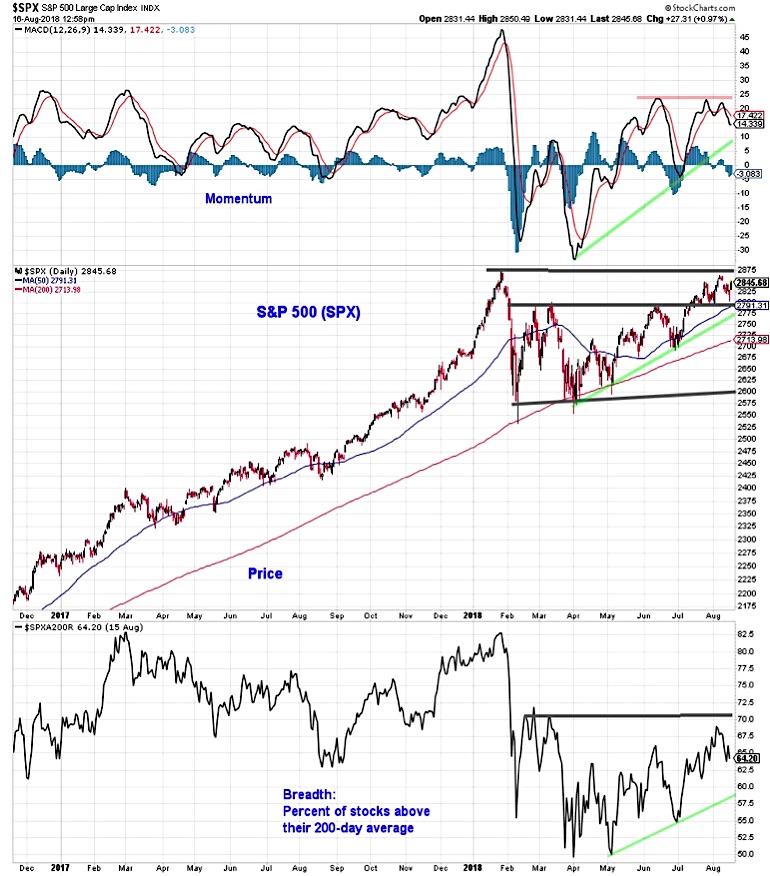
The S&P 500 (INDEXCBOE: .INX) has been able to hold support near 2800, a level that proved to be formidable resistance earlier this year. But neither momentum nor breadth (as measured by the percentage of stocks above their 200-day averages) has confirmed the price strength. This lack of conviction comes at stocks are in a seasonally challenging time of year.
A recent study by Ned Davis Research shows that the S&P 500 has experienced a median peak-to-trough pullback of 9% in the second half of mid-term election years. Recession-related years have seen pullbacks of more than twice that amount, while mid-term election years that have been relatively quiet from an external catalyst perspective have seen pullbacks of half that amount.
We see little evidence of domestic recession but also a global macro environment that has plenty of potential catalysts that could trigger a pullback. While price has been resilient, risks are high in the face of a deteriorating global backdrop.
The health of the broad market remains a hot discussion topic. Bulls will point to the new highs being made by the cumulative advance/decline lines across a number of indexes and exchanges, while those with a more cautious view can show that this year’s stock market gains can be attributed to a relatively small handful of stocks (for the S&P 500, just three stocks account for more than half of the index’s overall gain). Cumulative advance/declines lines provided false signals in 2011 and 2015 (making new highs after the S&P 500 peaked but prior to the eventual bear market lows).
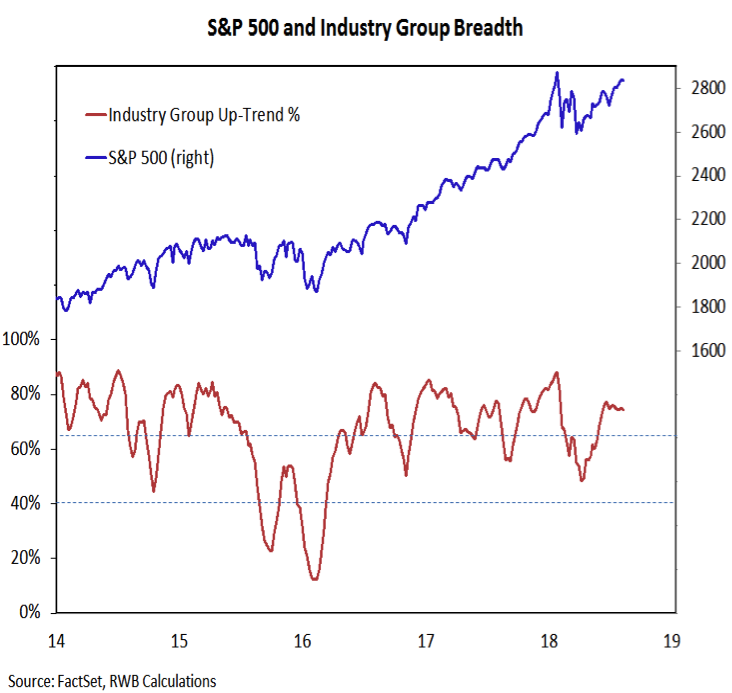
Our look at longer-term breadth trends is usually through the lens of the percentage of industry groups in up-trends. That indicator improved as the S&P 500 moved off its early year lows, but has stalled more recently and not made a new high in the past two months.
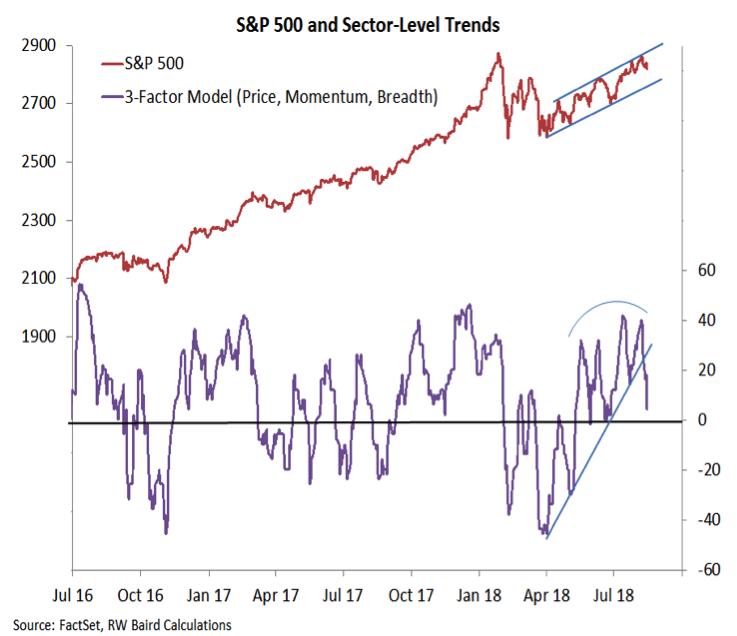
While longer-term breadth trends have been somewhat stable, shorter-term trends are seeing some deterioration. Our sector-level trend model looks at shorter-term (65-day) price, momentum, and breadth trends for the S&P 500 sectors. After making a series of higher lows and higher highs since bottoming in early April, this indicator has begun to struggle. The most recent high on the S&P 500 accompanied by a lower high from our sector-level trend indicator and that has been followed by a break below the rising trend line. Weakening in sector-level trends suggests the S&P 500 may be losing some internal support that has helped carry the index to within a few percentage points of its January peak.
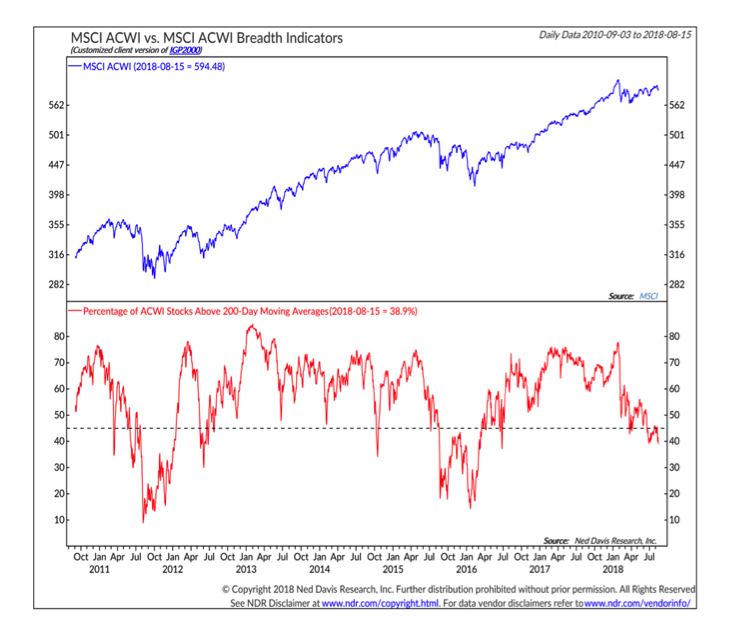
The global back drop is becoming more challenging. An increasing percentage of country-level indexes are seeing their 50-day averages cross below their 200-day averages. Both the MSCI EAFE Index and the Emerging Market Index made new 52-week lows this week (although in neither case was price weakness accompanied by expanding downside momentum – a potentially positive development). At the issue level, while 60% of S&P 500 stocks are above their 200-day averages, less than 40% of stocks in the All-Country World Index are above their 200-day averages. This breadth deterioration is similar to what was seen in 2011 and 2015.
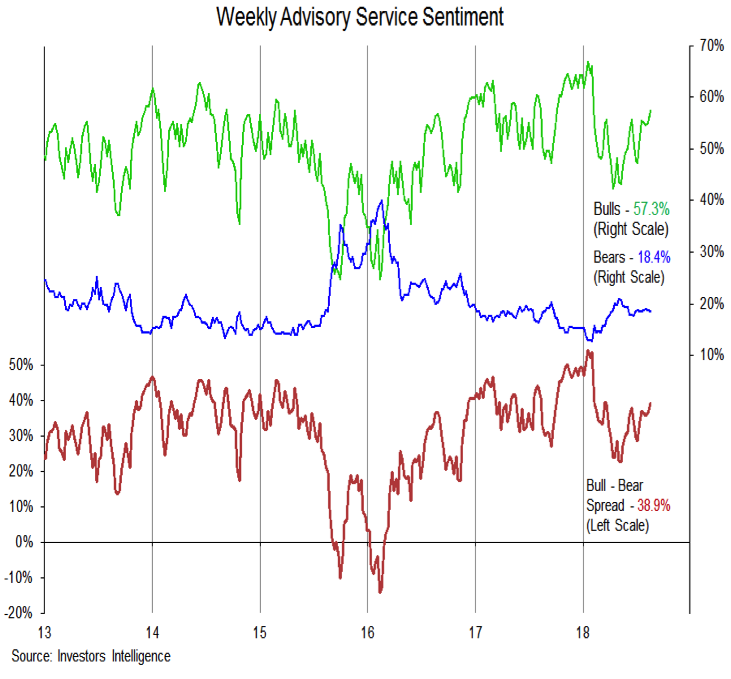
It is not just price action in the market that has been mixed, but investor sentiment as well. Put/call ratios have been moving higher as options traders have turned more nervous. Offsetting this has been optimism among advisory services. The latest Investors Intelligence data shows advisory service bulls moving to their highest level since early February. This has not, however, been accompanied by a meaningful pullback in bears. Bears have been little changed over the past two months, and are well above their early-year low near 12%.
Twitter: @WillieDelwiche
Any opinions expressed herein are solely those of the author, and do not in any way represent the views or opinions of any other person or entity.


