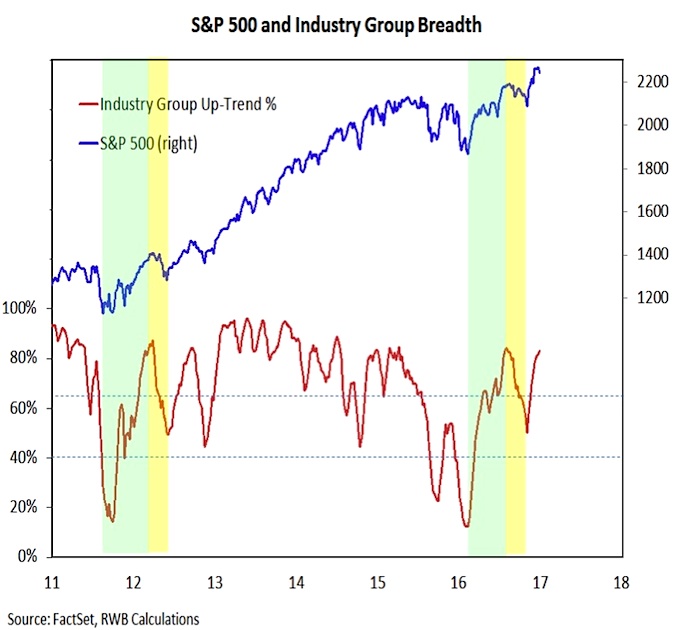
Market Breadth
The pre-election pullback failed to meaningfully weaken the improving breadth trend seen in our industry group trend indicator. This indicator has continued to climb even as stocks have been range bound in recent weeks and it is close to making a new recovery high.
With longer-term breadth trends improving, any near-term weakness that does emerge in stocks is expected to be limited in degree and duration.
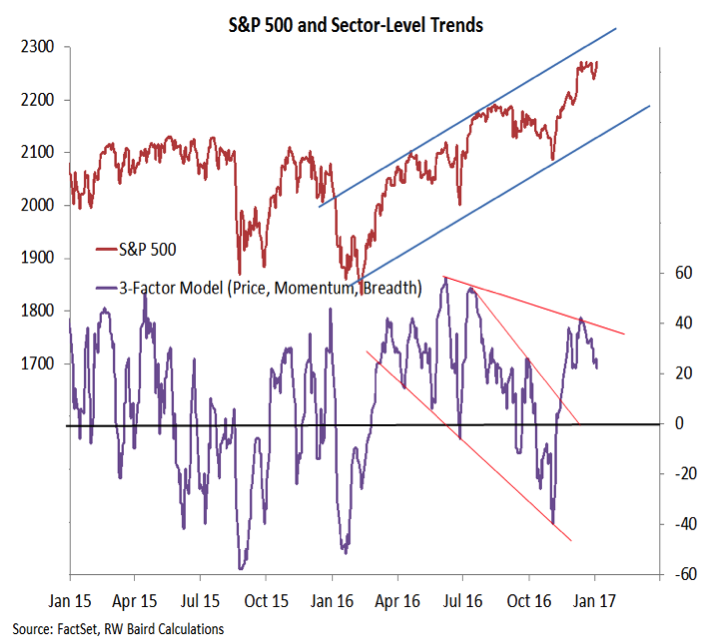
S&P Sector Trends
While weekly industry-group trends have continued to improve, our daily measure of sector-level trends have not. This indicator failed to confirm the new high on the S&P 500 in early December, and has lost ground since. Breaking the pattern of lower highs would be an important near-term signal that the market is getting in gear to the upside.
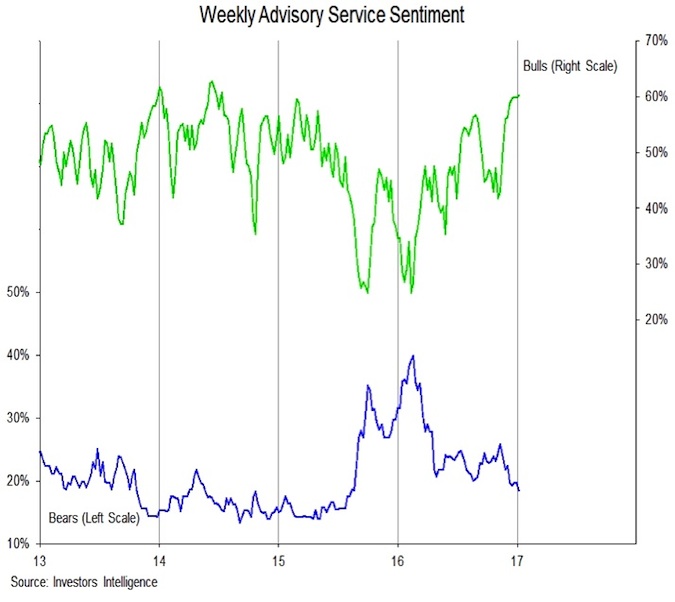
Investor Sentiment
Near-term consolidation in stocks following rallies to new highs can often be opportunities to work off excessive optimism. That does not appear to have been the case in the current situation. Data from Investors Intelligences shows that among advisory services, Bears (18%) are at their lowest level since mid-2015 and Bulls (60%) are at their highest level since mid-2014. While stocks do not always immediately correct in the wake of these types of readings, near-term upside does tend to be limited (and there is a bias toward increased volatility).
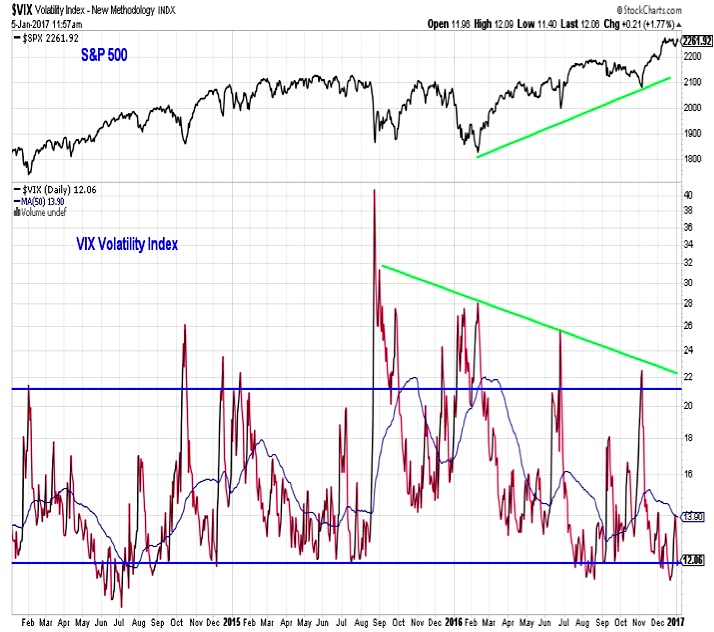
Volatility (VIX)
There appears to be plenty of room for volatility to expand with the VIX Volatility Index (INDEXCBOE:VIX) currently near 12.
As with excessive optimism, low VIX readings do not immediately provoke stock market weakness. However, the recent experience is that the balance between risk and reward tends to tilt toward risk when such widespread complacency is seen.
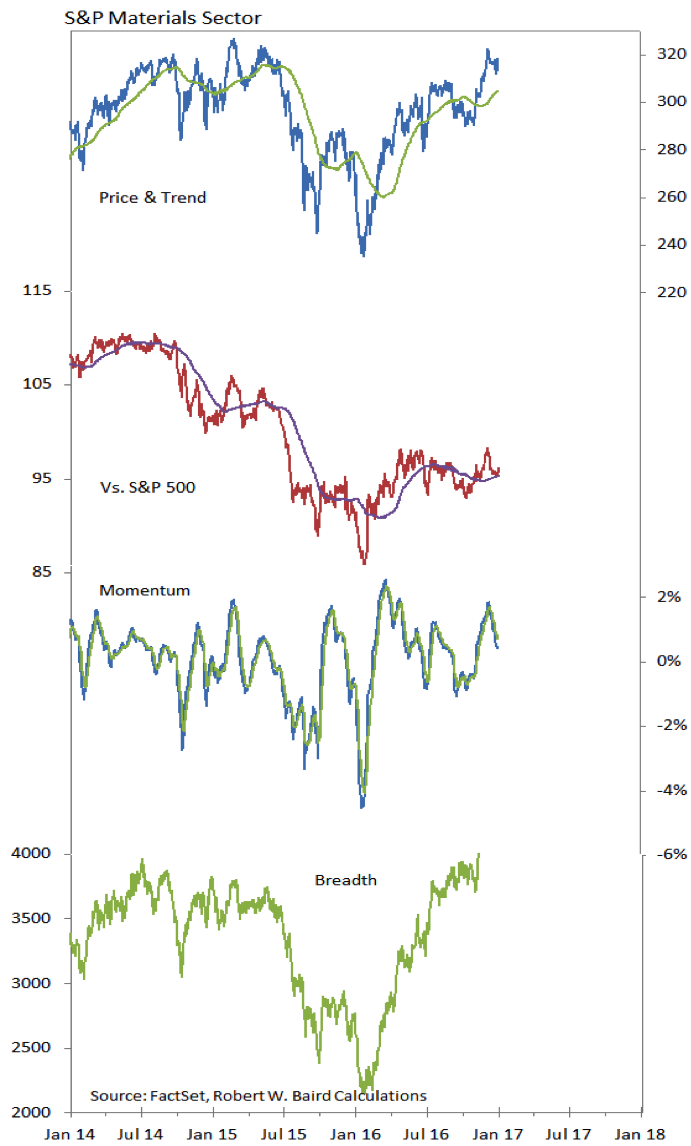
S&P Materials Sector
The Materials sector continues to rebound on both an absolute and relative price basis. Long-term down-trends are being challenged and violated, while emerging up-trends have provided support. Momentum has cooled recently, but the pattern of higher lows remains intact and breadth has broken out to a new high.
Thanks for reading.
Twitter: @WillieDelwiche
Any opinions expressed herein are solely those of the author, and do not in any way represent the views or opinions of any other person or entity.


: Showing Some Signs of Emerging Strength")
