Weekly Stock Market Outlook & Technical Review January 6th
In this research note, we will look at some key stock market indicators, the health of the S&P 500 Index (INDEXSP:.INX), and a handful of emerging themes that we are watching in our investing research:
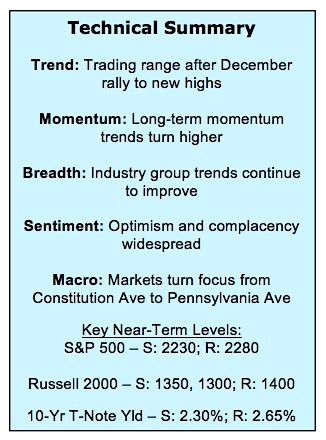
Momentum Trend a Tailwind Even with Stocks in Trading Range – The S&P 500 has slipped into a month-long trading range with support near 2230 and resistance near 2280. Short-term momentum has improved somewhat in recent trading sessions. A more bullish momentum tailwind can be seen on the weekly chart.
Short-Term View Mixed, but Long-Term Breadth Trends Remain Strong – Sector-level trends for price, momentum and breadth did not confirm the new S&P 500 high in December and have deteriorated as the index has moved sideways. Industry group breadth has continued to improve, with 83% of the groups in the S&P 1500 now in up-trends.
Widespread Optimism Could Limit Near-Term Rally Opportunities – Investors have remained optimistic even as stocks have struggled to make headway over the past four weeks. Typically, periods of consolidation for stocks allow for optimism to unwind, but this time it appears to have intensified. This could limit near-term rally opportunities and increases the risk that stocks could work lower before the long-term up-trend is re-asserted.
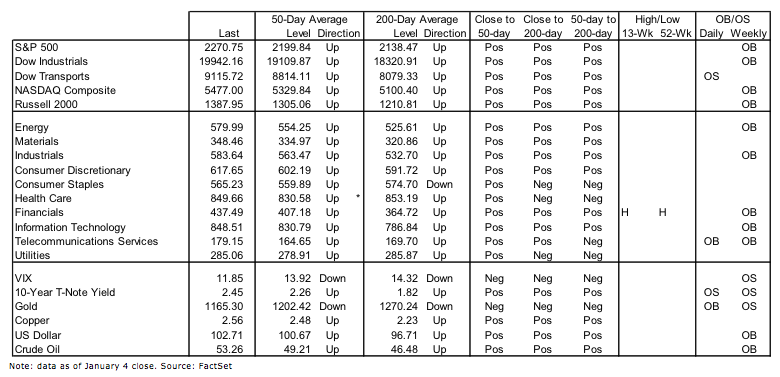
Stock Market Indicators
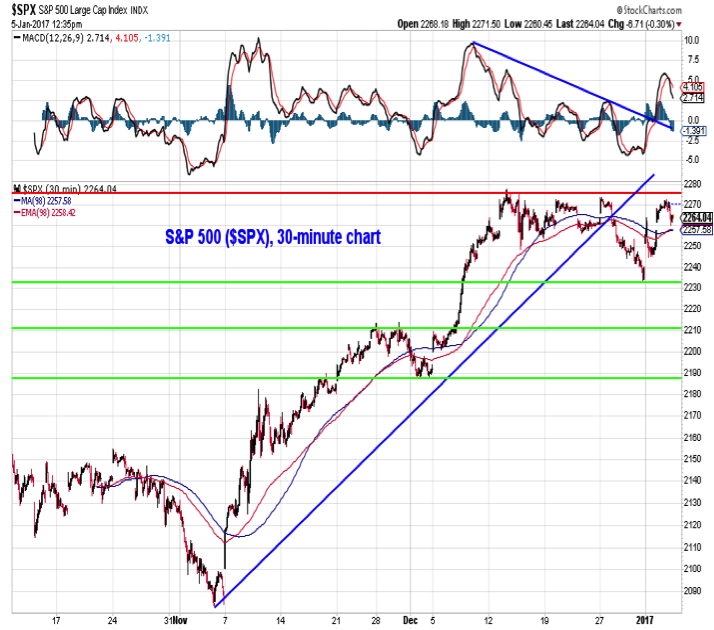
S&P 500 Index
Since making a new all-time high in early December, the S&P 500 has slipped into a near-term trading range. Short-term momentum faded and the price trend-line off of the early November lows has been broken. While momentum has turned higher as 2017 has begun, there is little evidence here that stocks are poised for an upside breakout. More likely, especially when viewed in context with the near-term breadth and sentiment trends, is that support levels get tested.
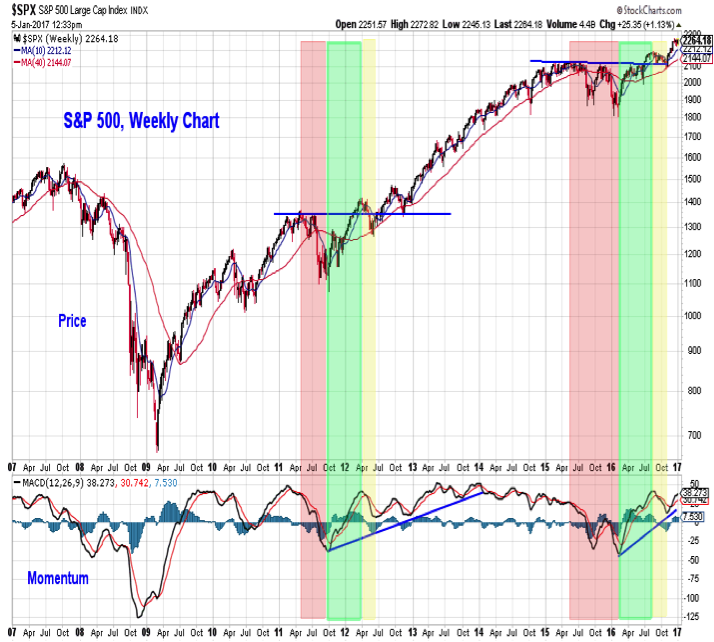
While near-term upside may appear to be limited, the longer-term price and momentum trends remain favorable. The S&P 500 began a new cyclical bull market early in 2016, and the late-year consolidation provided an important reset for momentum.
continue reading on the next page…


: Showing Some Signs of Emerging Strength")
