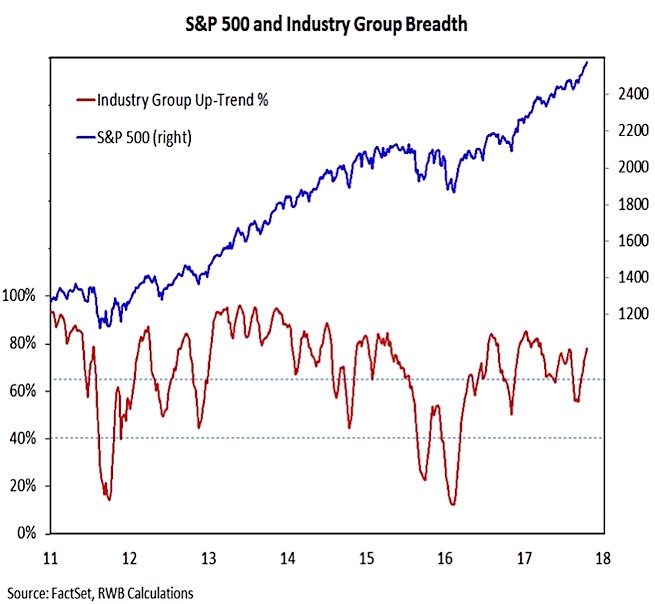
Market Breadth (continued)
While there is some evidence that short-term breadth trends have cooled, longer-term trends are heading in the right direction. The percentage of industry groups in up-trends continues to expand. Currently at 78%, this indicator has now surpassed the July high and is moving towards the early-year peak near 85%.
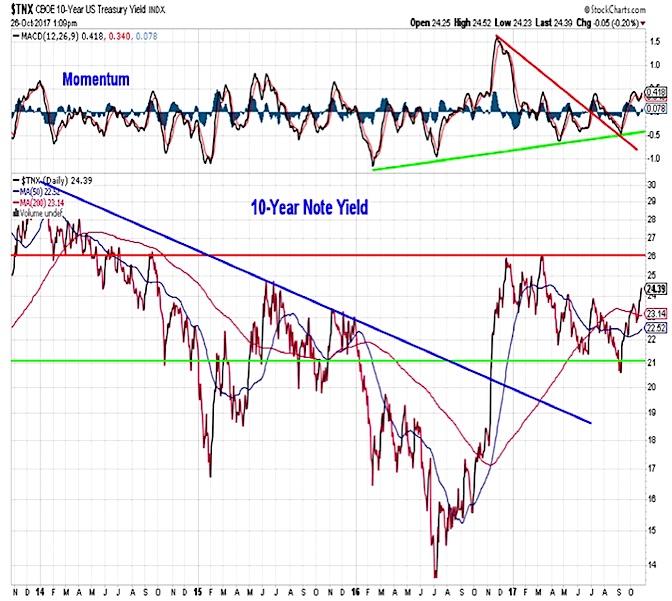
10-Year U.S. Treasury Note Yield
The yield on the 10-year T-Note has moved off of its recent low and has broken above 2.40% (which had been resistance). This could set up a test of the early-year highs near 2.60%. Momentum continues to expand to the upside and sentiment in the bond market has yet to turn excessively pessimistic (suggesting there could be further near-term upside in yields).
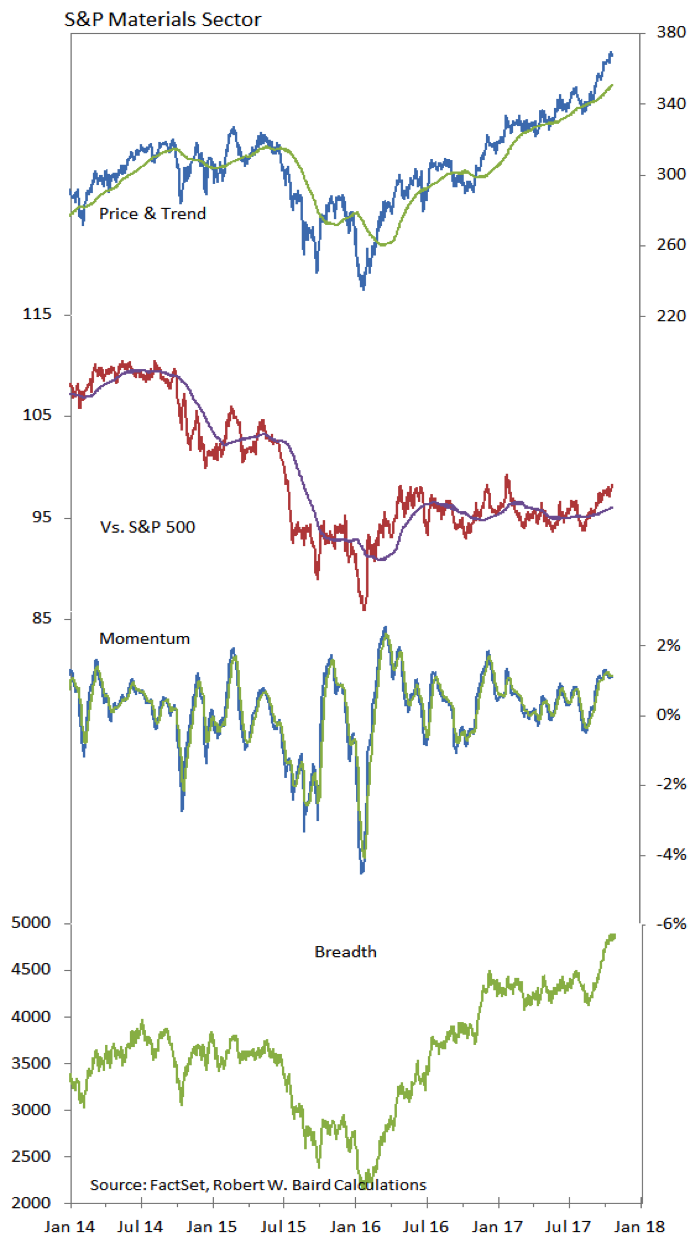
S&P Materials Sector
The Materials sector remains in the relative strength ranking leadership group and has been the second best (after Technology) performing sector in 2017. The sector is making new highs on an absolute basis, and the relative price trend is improving. Breath remains strong and momentum has broken through a downtrend.
Thanks for reading.
Twitter: @WillieDelwiche
Any opinions expressed herein are solely those of the author, and do not in any way represent the views or opinions of any other person or entity.


