The stock market rose last week, with the S&P 500 (NYSEARCA: SPY) up 128 points to 2760, an increase of 4.8%.
It was truly a big week for the bulls.
The markets are focusing on possible positive outcomes that could result from President Trump’s meeting with President Xi Jinping at the G20 meeting this weekend.
So where to next?
Our projection this week is for stocks to rise to our resistance zone around 2772 and then decline to our rising support zone around 2708.
The success of Trump’s meeting will tell us about the strength of next week’s rally – and the depth of the decline that follows.
S&P 500 Market Cycle Outlook for the Week of December 3, 2018:
The stock market posted a nice recovery last week. An oversold environment set up a big relief rally, while news events gave investors hope, as I pointed out in the latest Market Week show.
On Monday, President Trump told the Wall Street Journal that it was unlikely he would delay the planned increase in tariffs from 10% to 25%. He also suggested that it might be appropriate to impose tariffs on electronics produced in China, including iPhones.
Then at a press conference, chief economic advisor Larry Kudlow emphasized the productive preparations for the upcoming meeting between Trump and Chinese President Xi Jinping. “We are having a lot of communication with the Chinese government at all levels,” he said.
But it was the Fed that propelled stocks higher on Wednesday when Chair Jerome Powell’s speech was perceived as dovish compared to his hawkish early-October comments.
“Interest rates are still low by historical standards, and they remain just below the broad range of estimates of the level that would be neutral for the economy,” he said, with “neutral” referring to a rate which is, “neither speeding up nor slowing down growth.”
The market perceived this as meaning that we were “just below” neutral in contrast to his October comment that we were a “long way” from neutral. While most observers believe that the Fed will increase rates at the December meeting, the number of hikes in 2019 is now being debated.
Looking ahead, our outlook on stocks is becoming somewhat positive for the near term. Although we still believe there is trouble in the intermediate term, with markets perhaps rallying into January or even February before hitting serious trouble.
S&P 500 (SPX) Daily Chart
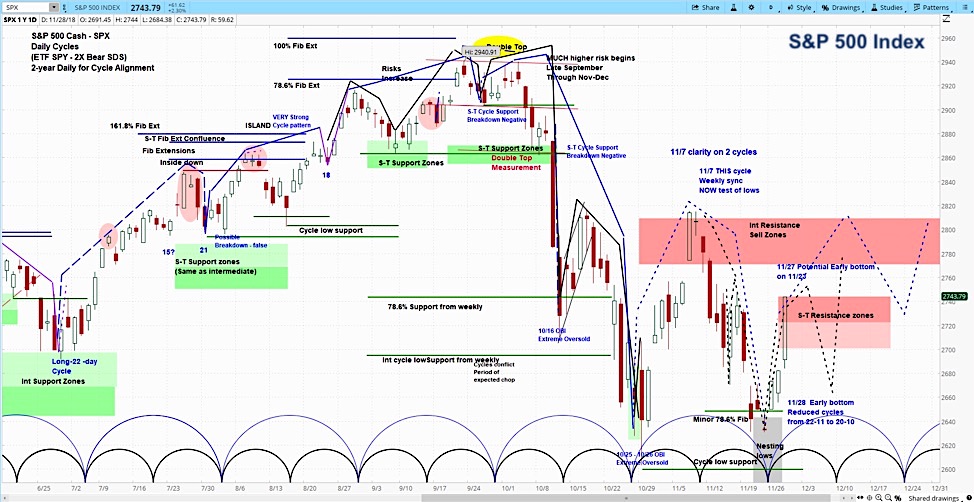
While the S&P 500 followed our basic projection last week, it rallied more than we thought it would and it rallied a bit sooner in the week than we thought it would. These are bullish indicators that we integrate into our analytical approach which focuses on market cycles to project future price action.
For the coming week, we are looking for the market to rise to 2772, followed by a decline to 2708, which is the top of a rising support zone. This is based in part on the minor cycles, labelled in black on the chart above.
Our analysis will depend to a degree on the outcomes of the meeting between Trump and Xi, with a perceived positive outcome pushing markets higher and also lifting the support zone. We expect the current minor cycle to complete a small downward correction by around December 7.
Steve “Slim” Miller has spent over 40 years trading stocks, options, futures on and off the trading floor. His nickname came from his trading floor badge, SLM. For more, visit askSlim.com.
Twitter: @askslim
Any opinions expressed herein are solely those of the author, and do not in any way represent the views or opinions of any other person or entity.


