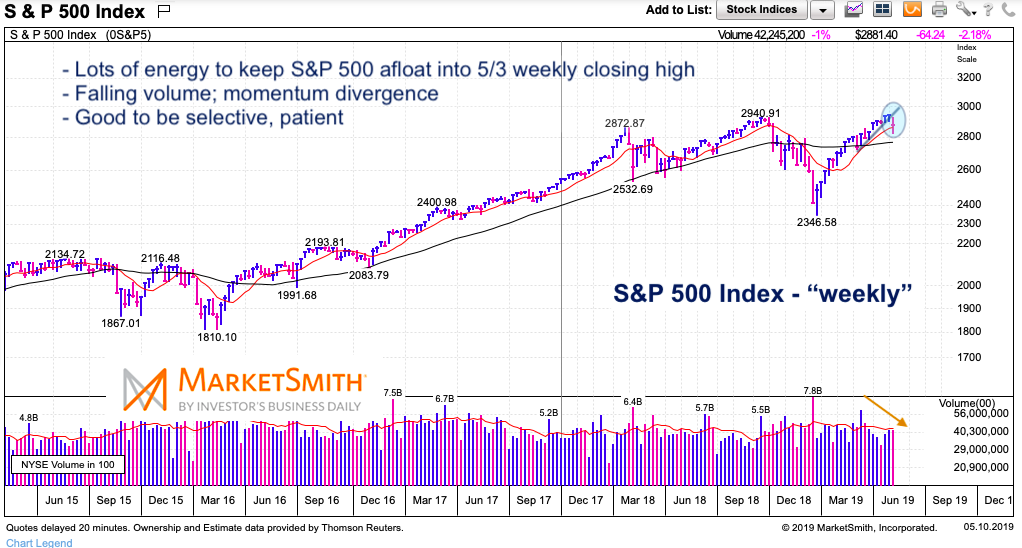
The week of May 3rd was important – perhaps an important closing high for the S&P 500 (we shall see). During that week, we recovered losses to produce our highest weekly close on the S&P 500 Index.
This occurred under falling momentum and volume (divergences) so it shouldn’t be a surprise that last week (ending 5/10) saw investors hit the sell button.
The catalyst was US – China trade tensions. Investor uncertainty may also be clouded by an item that is currently out of the news headlines: European elections. So May should be a busy (and volatile) month.
Last week’s selling did see a moderate recovery rally… that sucked up energy and still failed to produce a hammer candlestick – we ended up with a fat doji (under divergence and falling volume). We also lost the rising support line in the wedge pattern I posted about on Twitter (you can see that in the chart below). So I am not surprised to see futures trading lower again. See the chart below – I’ll have a broader update (daily & weekly) later this week with thoughts on market weakness.
Note that the following MarketSmith charts are built with Investors Business Daily’s product suite.
I am an Investors Business Daily (IBD) partner and promote the use of their products. The entire platform offers a good mix of technical and fundamental data and education.
S&P 500 Weekly Chart
Twitter: @andrewnyquist
The author has a position in mentioned securities at the time of publication. Any opinions expressed herein are solely those of the author, and do not in any way represent the views or opinions of any other person or entity.

: Cup (and Maybe Handle) Watch")
 Trading Near Top Of Price Range")

