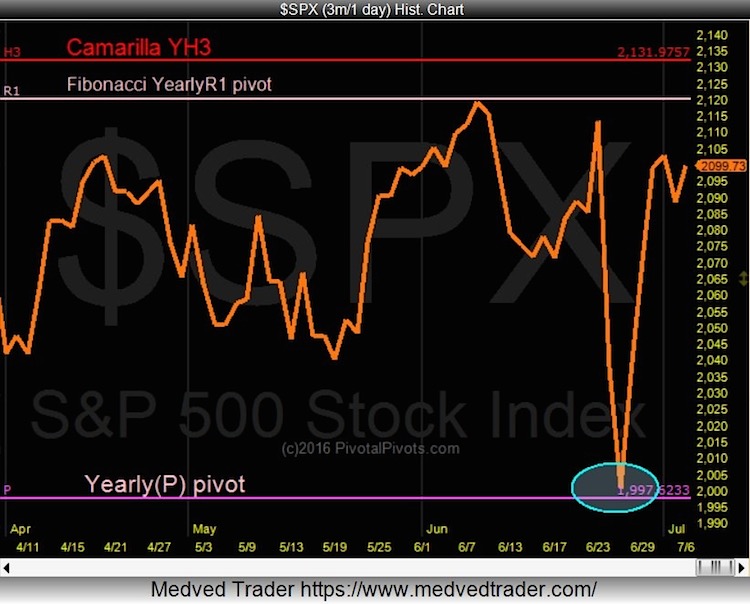
A few weeks ago, I wrote a post highlighting an important S&P 500 Index (INDEXSP:.INX) yearly trading pivot that served as both a price target and trading support level. That level was 1997. And post-Brexit, the S&P 500 dipped as low as 1991 (and it’s lowest close was 2000).
From there we bounced. And with strength.
As I like to say, the market trades pivot to pivot. And we are now nearing a couple of important yearly trading pivots and price targets. Those are the Fibonacci Yearly R1 pivot (2120) and the Camarilla Yearly H3 (2132). See the chart below.
What the market does at these levels will decide the next move and targets. Follow me here and one twitter for updates on key yearly trading pivots (amongst others).
Thanks for reading and have a great weekend.
Twitter: @Pivotal_Pivots
The author may have positions in related securities at the time of publication. Any opinions expressed herein are solely those of the author, and do not in any way represent the views or opinions of any other person or entity.


