The noise across the financial markets is reaching maximum overload – bulls are yapping, bears are yapping, and we have a new piece of Trump news (or the Fed) every day.
So today, I want to “tune out the noise” and look at a unique method for finding price targets: circles. We’ll look at (revisit) the S&P 500 Index (INDEXSP:.INX) and the possibility for an S&P 500 top around 2400.
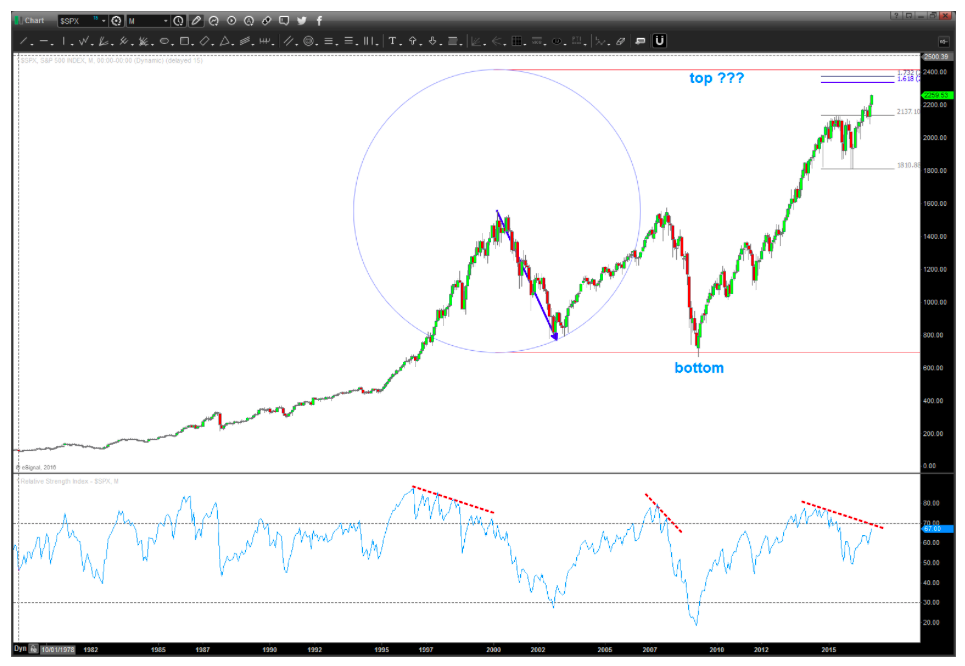
5 months ago, I shared a chart with a clockwork circle from 2000 highs to 2002 lows (first chart below). Note that the upside of that circle has come into play recently. I’m a math and patterns guy, so forgive me if I lost you…
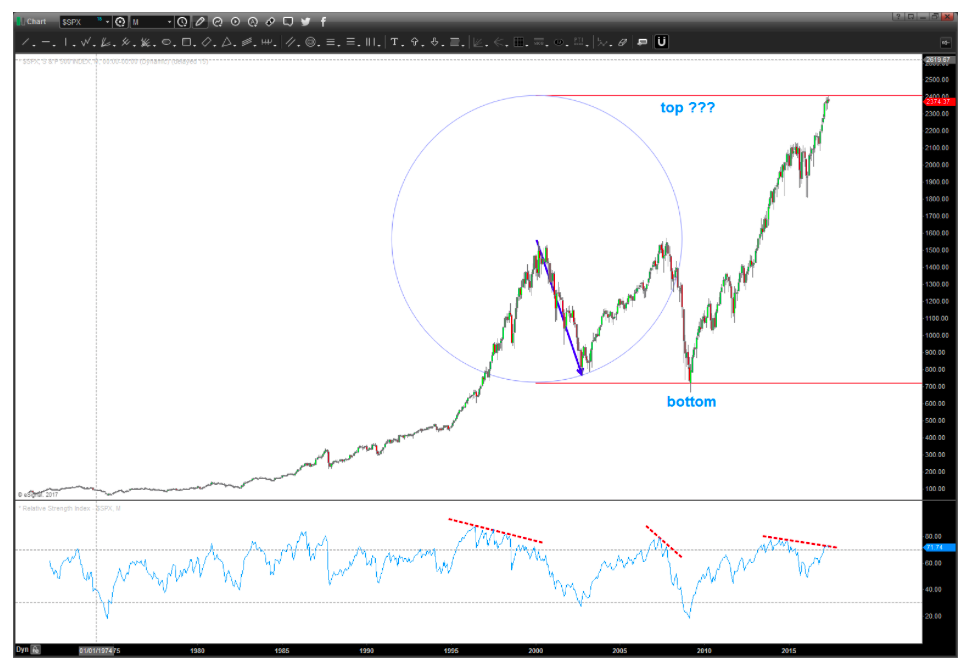
Could the recent sell off have something to do with hitting the top of the circle (chart 2 below)? It’s clearly resistance that the market will need to get through to continue its ascent. Could it mark a significant top? Probably not, but it’s worth respecting in my opinion.
S&P 500 Top 2400? From Early 2017
S&P 500 Top 2400? May 2017 (updated)
Thanks for reading and have a great week.
Twitter: @BartsCharts
Author does not have a position in mentioned securities at the time of publication. Any opinions expressed herein are solely those of the author, and do not in any way represent the views or opinions of any other person or entity.


 Ready To Break Out?")
 Ready To Break Out?")


