This week could prove to be a pivotal week for traders in the stock market, as Time & Price are converging.
The last time Time & Price converged was in July 2014. The S&P 500 Index (INDEXSP:.INX) fell 80 points and the Dow Jones Industrial Average (INDEXDJX:.DJI) fell 800 points in 2 weeks.
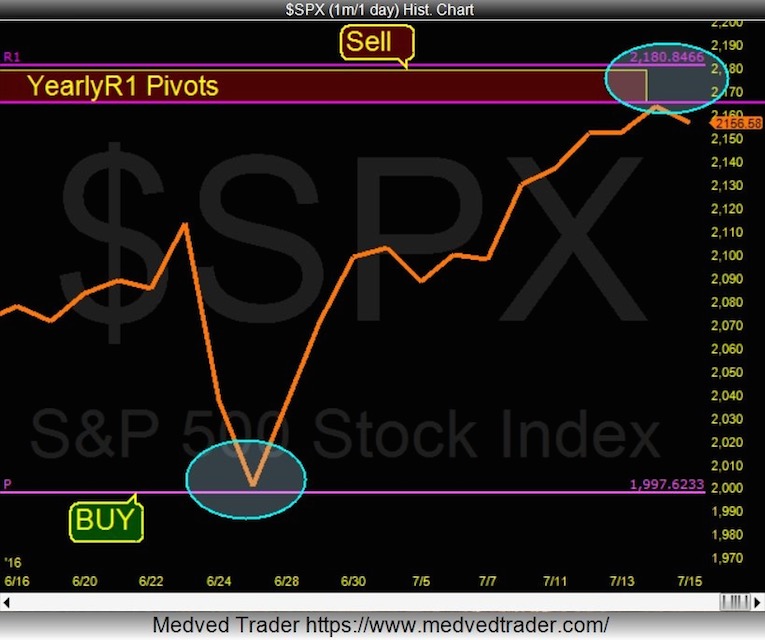
PRICE: In the past month the S&P 500 (SPX) bounced off the Yearly(P) Pivot at 1997 (per my article) and has rallied up to the YearlyR1 Pivots @ 2163-2180. Computer algorithms moves price from predetermined Pivot point to pivot point.
TIME: The 2016 Bradley Model Sidergrapgh which means Star Graph shows a trend change date next week. Donald Bradley developed this model back in the 1940’s. He wrote a book called “Stock Market Prediction” which is out of print. From my experience his model is uncanny with its predictions.
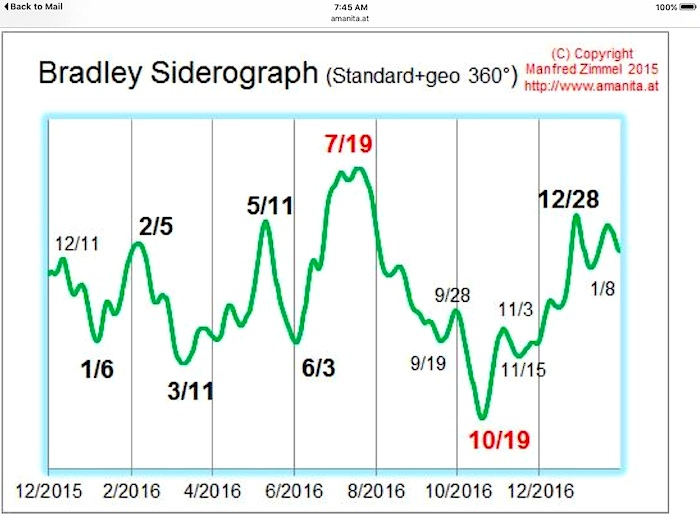
With the S&P 500 testing strong resistance at the YearlyR1 Pivots and the Bradley Model trend change date converging next week, we may see a big pullback or correction soon. When time & price come together, it can be a powerful thing.
Please be sure to checkout our new website PivotalPivots.com.
Thanks for reading.
Twitter: @Pivotal_Pivots
The author may have positions in related securities at the time of publication. Any opinions expressed herein are solely those of the author, and do not in any way represent the views or opinions of any other person or entity.


