S&P 500 Futures: (2-3 Days) – Bullish
Pullback attempts yet again were bought up by the bulls. The S&P 500 (INDEXSP:.INX) bottomed right where it needed to before rallying nearly 15 handles off early lows.
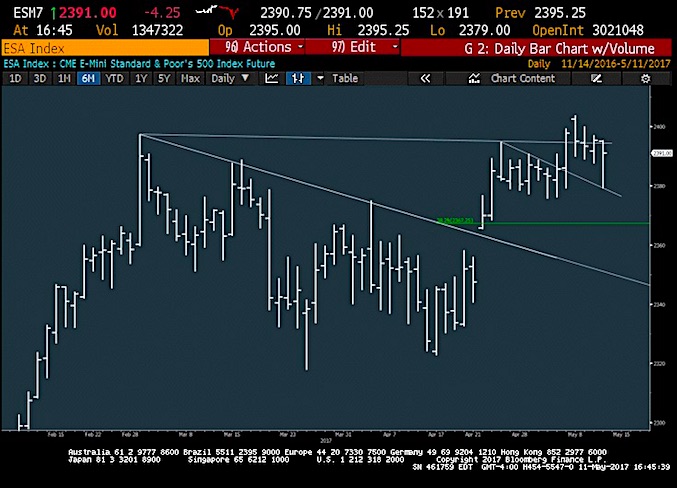
Unless 2375 (futures) / 2378 (cash) is breached on a close, it’s still wise to play for more upside. Look for rally to extend up above 2424 and as high as 2435 before any real resistance.
As daily chart below shows, the attempted selloff held right near the trend from the prior highs. The index continues to hold above its 3 day lows. One concern to note is that the Russell 2000 (INDEXRUSSELL:RUT) and small caps are still lagging (see further below).
While momentum has dipped a bit since late April, there remains no real evidence of selling pressure. A push back to new highs looks likely before any real peak gets underway.
Technical Thoughts
Yesterday’s snapback rally makes it difficult to be overly concerned (just yet) about the possibility of a short-term selloff. The S&P 500 bottomed where it needed to and rallied well up off its lows – this is a near-term positive. We’ve now seen two straight days that prices rebounded from early weakness.
Market breadth finished at around 3/2 negative yesterday, and sectors like Retailing and Consumer Durables were particularly hard hit. However, no sector finished down more than 0.60%, and while /Discretionary, Financials, Real Estate and Telecomm all underperformed, Health Care showed some resilience in holding key support for the second straight day.
Here are a few concerns heading into the end of the week: a bit of negative divergence on weekly charts, the ongoing low number of stocks hitting new highs and trading above 50, 200 day moving averages, the weakness in the Transports, and a couple cycles that suggest markets should be peaking within the next few weeks. Given that Apple (NASDAQ:AAPL) is getting extended and is a key constituent among many ETF’s this is also a source of concern, as it looks to stall out near 160.
Chart Spotlight – Small Caps Relative Weakness
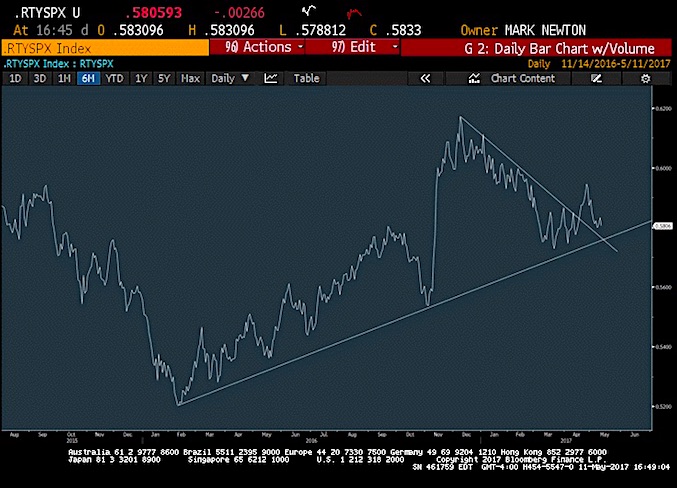
One negative consequence with the minor stalling out in late April had to do with Small-caps, which retraced back into the recent range, and should be watched carefully for evidence of this group turning down in a bigger fashion. Earlier this year, RTY vs SPX in ratio form managed to bottom out near key trendline support, and the pullback thus far has not done any real damage to the uptrend from last February. However, any evidence of further deterioration in the Russell 2000 would present issues with the relative line being tested and broken. This in turn would affect the quality of the rally at a time when Transports have already been quite weak. For now, the chart shows the Small-caps weakness over the last few weeks as being part of this larger uptrend, and has not been violated. But this chart should be kept on the front burner in monitoring equities in the weeks/months ahead, as its thought that an eventual break should happen into the fall.
Get more of my ideas and daily trading insights over at Newton Advisor.
Thanks for reading!
Twitter: @MarkNewtonCMT
Any opinions expressed herein are solely those of the author, and do not in any way represent the views or opinions of any other person or entity.


: Showing Some Signs of Emerging Strength")
