It’s been a wild year for stocks. And last week exemplified that. It wasn’t just any old wild week, though… so it’s only fitting that we dig in and look at a few market rarities and historic market returns.
In my last post, I introduced you to one of my favorite quotes regarding the S&P 500 Index (INDEXSP:.INX). Here it is once more:
“Going forward, the S&P 500 will probably trade beyond the limits of human imagination.”
What transpired the last seven trading days would seem to fit the bill, and it’s not limited to just the S&P 500. Stocks plunged in response to “Brexit”, only to then recover nearly everything they lost from June 23rd’s close. Alternatively, the yield on a 10 Year United States Treasury Bond (TNX), plunged in response to “Brexit”, only to then recover absolutely nothing. As someone who has a fascination with identifying rare price action and their subsequent forward tendencies, this week was a dream. Here’s a daily journal of some of the rareness I was able to capture the last five days in both the stock market and bond market.
June 27th – A Historic Two Day Plunge in the 10 Year U.S. Treasury Bond Yield (TNX)
TNX closed June 23rd at 1.73%. Two days later TNX closed at 1.46%, a two-day decline of -16.04%. This is the single largest two-day decline for TNX dating back to 1962. Additionally, TNX declined by 5% or more two consecutive sessions on Friday June 24th and Monday June 27th, and back to back -5% sessions has only happened 4 other times since 1962. This led me to identify the tendencies for the S&P 500 following a crash in TNX. Looking at all two-day declines of greater than -10% for the 10 Year Yield since 1962 reveals the following historic market returns:
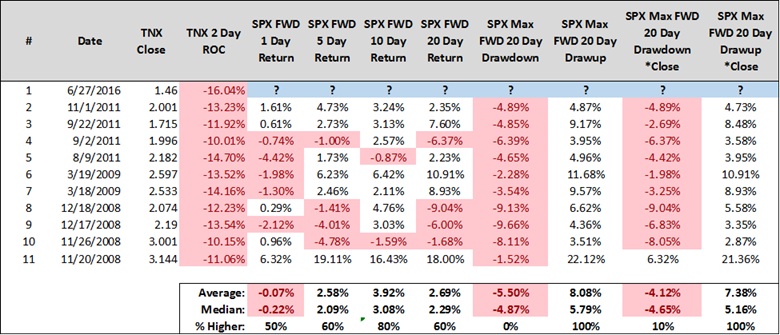
Historic market returns are nicely bullish forward 5, 10, and 20 trading days. Interestingly, the median forward 20 day drawup for the S&P500 following a two-day crash in TNX is/was 5.16%. With Monday’s signal date close for the S&P 500 being 2000.54, this targeted a forward 20 day close at 2103.76. Ironically, the S&P 500 closed today at 2102.04. The median drawup’s in the books.
However, when the 10 Year Yield (TNX) crashes over two trading sessions the S&P 500 usually doesn’t go unscathed over the forward 20 trading days. You’ll note that in all 10 prior instances where TNX plunged by more than -10% in two days, the S&P 500 traded below its signal date close at some point over the forward 20 days. You’ll also note it tends to do so by a meaningful margin, on average by -5.50%, with the lowest forward 20-day drawdown from signal date of all occurrences being -1.52%. This would target a trade back toward ~1900-1970 at some point prior to July 26th. Also, with the S&P 500 gaining 1.77% on Tuesday, and currently being up 5.11% the forward 4 days from signal date, the sample that looks eerily similar is 11/1/2011. I’ve annotated the chart below as the similarities and possibilities to the current market action is striking.
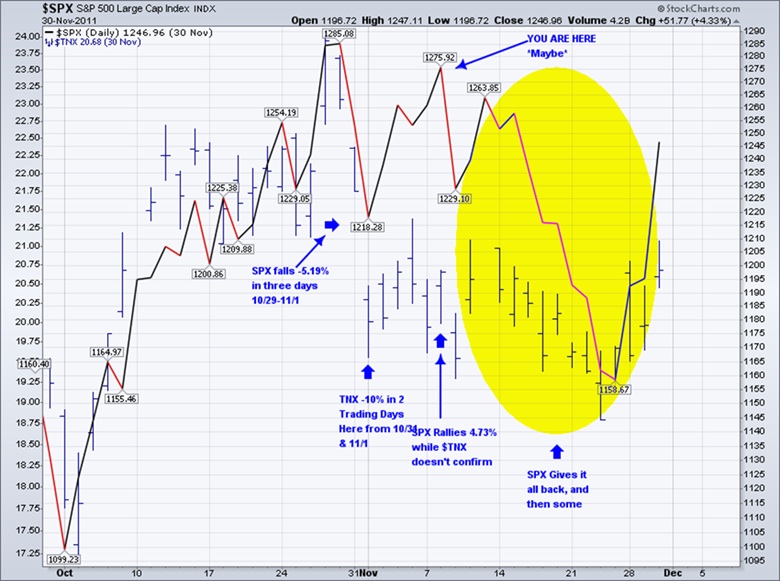
Can you imagine the S&P 500 trading down to ~1900-1970 prior to 7/26? Probably not, and that’s because the S&P 500 tends to trade beyond the limits of human imagination. Alternatively, history would perhaps suggest it’s also difficult to imagine a scenario where the S&P 500 doesn’t trade below 2000.54 prior to 7/26, as all 10 instances where TNX crashed by more than -10% in two trading days ultimately saw the S&P 500 trade below its closing value from the second trading session over the forward 20 days.
June 28th – S&P 500 Gains 1.5% and TYX Negative
On Tuesday June 28th the S&P 500 gained 1.77%, while the yield on a 30 Year United States Treasury Bond Yield (TYX) was red on the session, declining by -0.17%. This has happened 11 times since 2011 and has generally been a negative sign for the S&P 500 going forward with the index producing negative median forward 10 and 20 day historic market returns. The median forward 20 day drawdown is -4.65%
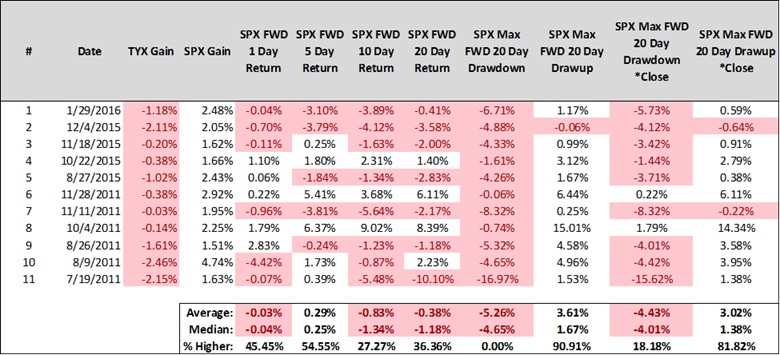
The S&P 500’s close on Tuesday was 2036.09, and we’re yet to spend one tick below Tuesday’s close. 100% of these prior 11 instances saw the S&P 500 trade below its signal date closing price over the forward 20 trading days, on average by -5.26%. Also, only 3 of 11 produced a forward 20-day drawdown of less than -4%. A -4.65% drawdown from signal date close would target ~1941 on or before 7/27. Either history will be made and the S&P 500 will not trade down below 2036.09 on or before 7/27, or those initiating short positions with the S&P 500 around 2100 will be rewarded yet again over the weeks ahead.
June 29th – S&P 500 Triggers Rare Plus/Minus Pattern Sequence.
At the close on June 29th, the S&P500’s trailing four day returns were as follows:
- 06/24: -3.60%
- 06/27: -1.80%
- 06/28: +1.78%
- 06/29: +1.70%
The stock market index’s pattern of daily returns was -1.5% or more two consecutive days, and +1.5% or more the next two trading sessions. This has occurred just 10 times since 1950 and tends to be an ominous sign with flat to negative forward 20 day stock market returns and massive forward 20 day drawdowns.
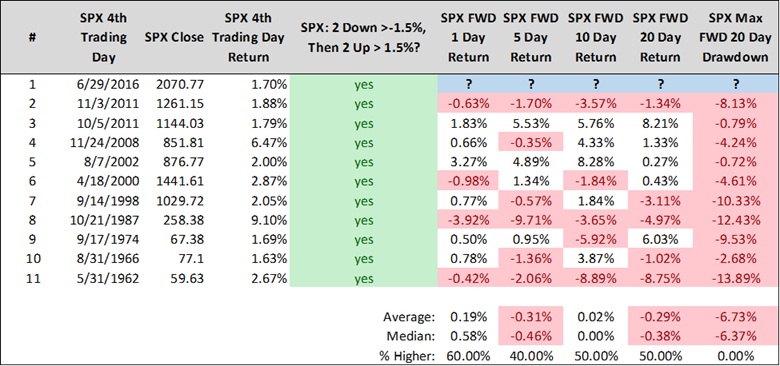
The median forward 20-day drawdown is -6.37% and only 3 of 10 didn’t drawdown more than -3%. On 6/30 the S&P 500 traded down to a low of 2070.00, so at present we’ve already drawdown 0.77, or 0.00%. Is that all the stock market is going to provide us? History says it’s unlikely. A -6.37% drawdown from signal date close would target 1945 on or before 7/28. Blasphemy, I know.
continue reading on the next page…


