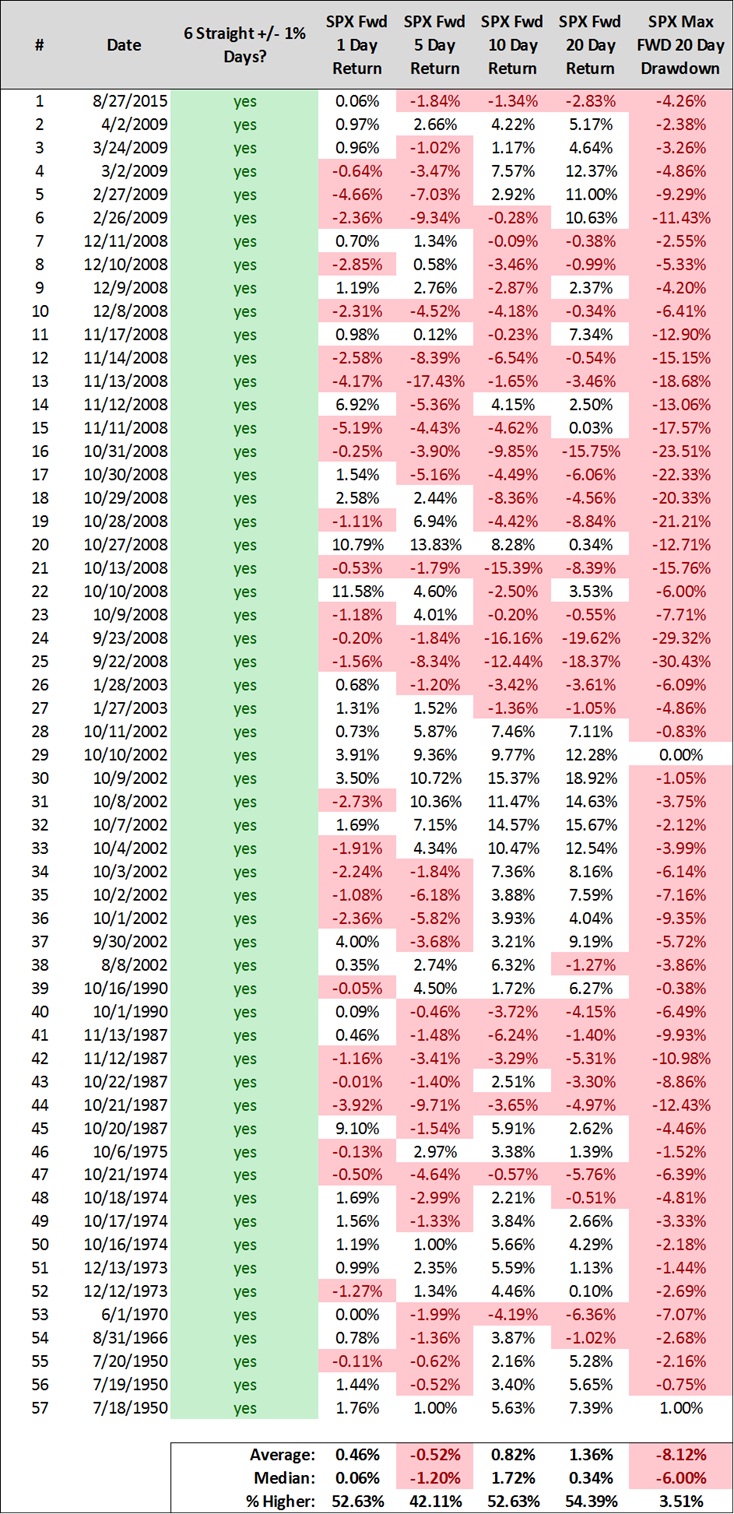
June 30th – 6 Consecutive +/- 1% days for the S&P500
Through Thursday’s close, the S&P 500 had gained or lost more than 1% six consecutive trading days. The indexes daily returns were:
- 06/23: +1.34%
- 06/24: -3.60%
- 06/27: -1.80%
- 06/28: +1.78%
- 06/29: +1.70%
- 06/30: +1.36%
Since 1950, this has happened 57 times. While historic market returns are higher 54% of the time over the forward 20 days, the median return is just 0.34%. Additionally, the median forward 20-day drawdown from the signal date close is -6.00%. The S&P 500’s signal date close for this study is 2098.86 and at the moment we’ve drawdown a whopping 0.96 points or 0.00%. A -6% drawdown from 2098.86 would target ~1972 on or before 07/28. That seems like mission impossible at the moment, doesn’t it? Remember, that’s exactly how a close on 7/1 at 2100+ felt on 6/27…
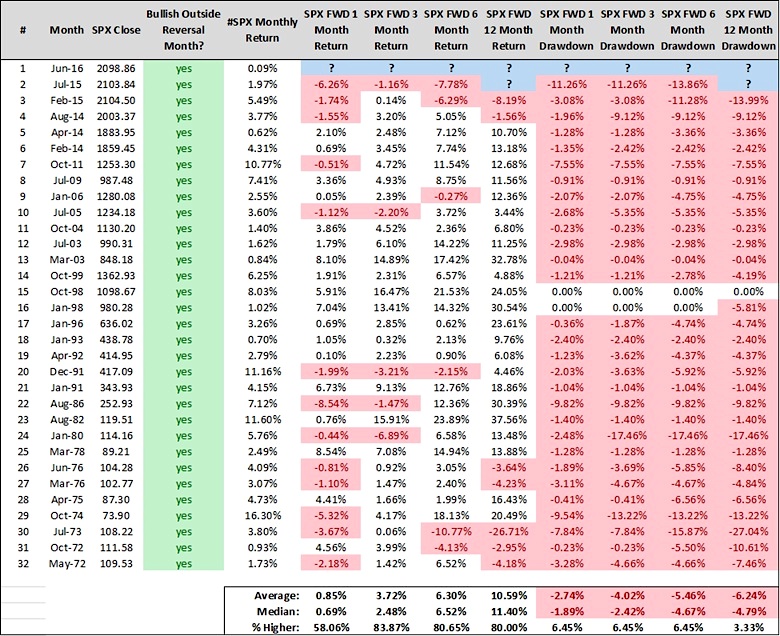
June 30th – S&P 500 Triggers Bullish Outside Reversal Month
The S&P 500’s price action in June included the following:
- A lower low than May’s low
- A higher high than May’s high
- A positive monthly close
Since 1970, there’s been 32 Bullish Outside Reversal Months. The S&P 500’s forward 12 month returns are higher 80% of the time for average and median returns of 10.59% and 11.40%. There haven’t been any significant landmines since 1973, although I’d be remiss in not mentioning the last two Bullish Outside Reversal Months (July 2015 & Feb 2015) weren’t kind to investors. That said, 21 of the last 25 saw the S&P 500 higher 12 months later with fairly muted average and median forward 12 month drawdowns.
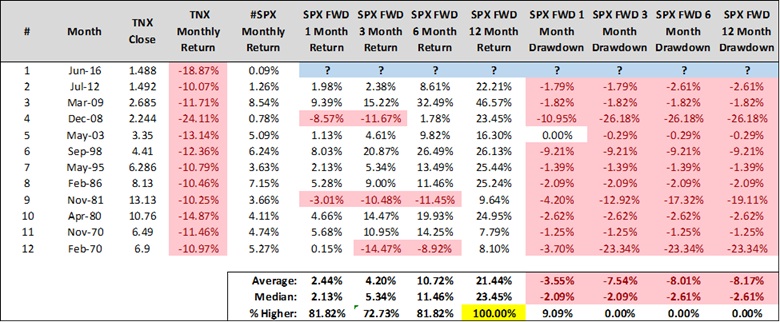
June 30th – 10 Year Yield (TNX) Declines by -10% or More In A Calendar Month
TNX declined -18.87% in June. Since 1970, June marks the 12th instance where TNX declined by -10% or more. The main observation here is the S&P 500’s forward 12 month returns have never been negative following calendar months where TNX declined by -10% or more. However, there are some absolutely wild drawdowns along the way, see 2008, 1998, 1981, and 1970.
Final Takeaway
I’ll leave you with a quote from Tom McClellan’s latest email that I think perfectly summarizes what lies ahead.
“We may still have to wait a few weeks or months before that strong initiation results in actual new highs for the major indices, but the portent is bullish for an uptrend starting later this year and lasting through 2017.”
History suggests a meaningful give back will occur prior to the end of July. However, evidence is also mounting that this may be the last stock market dip before we finally breakout to the upside. Hardly anyone can imagine a trade down back into to the 1900’s prior to the end of July. And if that occurs, hardly anyone will imagine a calendar year close beyond 2200. Some excitingly unpredictable times lie squarely ahead.
Thanks for reading.
Twitter: @SJD10304
The author may have a position in mentioned securities at the time of publication. Any opinions expressed herein are solely those of the author, and do not in any way represent the views or opinions of any other person or entity.


