Stock Market Trading Overview for July 13, 2018
The S&P 500 (NYSEARCA:SPY) is currently testing overhead resistance after a series of near-term higher lows.
Should we stall out at current price resistance, then traders should look for higher lows at support levels listed below. That said, we should also be prepared for a break out above resistance (and successful retest).
S&P 500 Futures
Tests of resistance and higher lows hold across the board on larger time frames.
Momentum beneath the S&P 500 (INDEXCBOE:.INX) is shifting to a more bullish reading as we hold support. Higher lows tested and held yesterday once again. Deep dips will continue to be buying zones. The bullets below represent the likely shift of trading momentum at the successful or failed retests at the levels noted.
- Buying pressure intraday will likely strengthen with a bullish retest of 2797.75
- Selling pressure intraday will likely strengthen with a bearish retest of 2794.75
- Resistance sits near 2796.75 to 2801.5, with 2809.75 and 2812.75 above that
- Support sits between 2795.25 and 2791.5, with 2786.75 and 2781.75
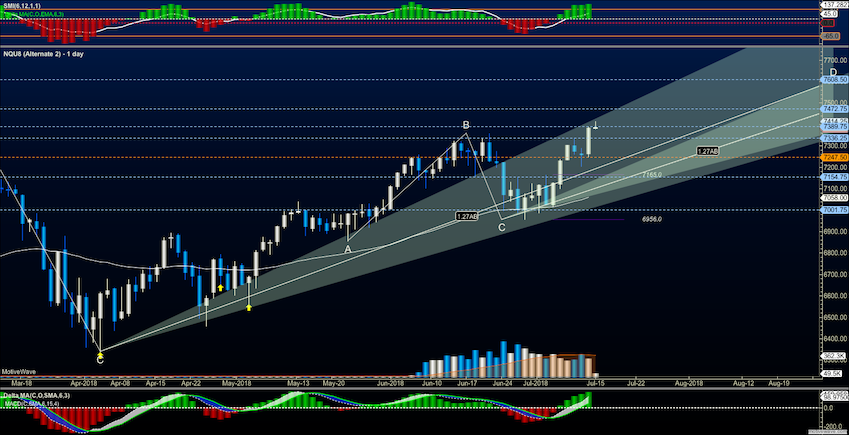
NASDAQ Futures
Tech traders breach near-term highs in a press forward from bullish earnings results. Pullbacks remain buying opportunities as we are in a building bullish undercurrent but buying breakouts to hold them in the move forward will become tenuous if we do not hold higher lows. The bullets below represent the likely shift of trading momentum at the successful or failed retests at the levels noted.
- Buying pressure intraday will likely strengthen with a bullish retest of 7414.75
- Selling pressure intraday will likely strengthen with a bearish retest of 7331.5
- Resistance sits near 7389.5 to 7412.5 with 7458.5 and 7477.25 above that
- Support sits between 7354.5 and 7334.5, with 7297.5 and 7247.75 below that.
WTI Crude Oil
Traders sell off the WTI with oil news. Deep dips into 70 are holding for now but we’ll need to see traders take us above 71.2, else we’ll see 69 again. The bullets below represent the likely shift of trading momentum at the successful or failed retests at the levels noted.
- Buying pressure intraday will likely strengthen with a bullish retest of 71.18
- Selling pressure intraday will strengthen with a bearish retest of 69.98
- Resistance sits near 71.46 to 72.14, with 72.78 and 73.5 above that
- Support holds near 70.24 to 69.29, with 68.64 and 68.11 below that
You can learn more about trading and our memberships HERE.
Twitter: @AnneMarieTrades
The author trades stock market futures every day and may have a position in mentioned securities at the time of publication. Any opinions expressed herein are solely those of the author, and do not in any way represent the views or opinions of any other person or entity.
: Creating Bullish Divergence?")


 and Semiconductors (SMH): Concerning Price Pattern?")


