Well, I guess my piece on “Time” on the stock market did the trick, as equities broke out a couple of days later with some nice follow through.
The S&P 500 (INDEXSP:.INX), the Dow Jones Industrials (INDEXDJX:.DJI), and the S&P 400 Mid Caps are all sitting right near their early March all-time-highs, while the Nasdaq Composite and Nasdaq 100, as well as the Russell 2000 (INDEXRUSSELL:RUT) have all catapulted to all time highs.
Speaking of time, it did not take long for the bullish juices to start flowing again as sentiment has turned quickly toward the bullish side of the fence once again. It’s funny how a couple of days of strong price action will do that! More on this later.
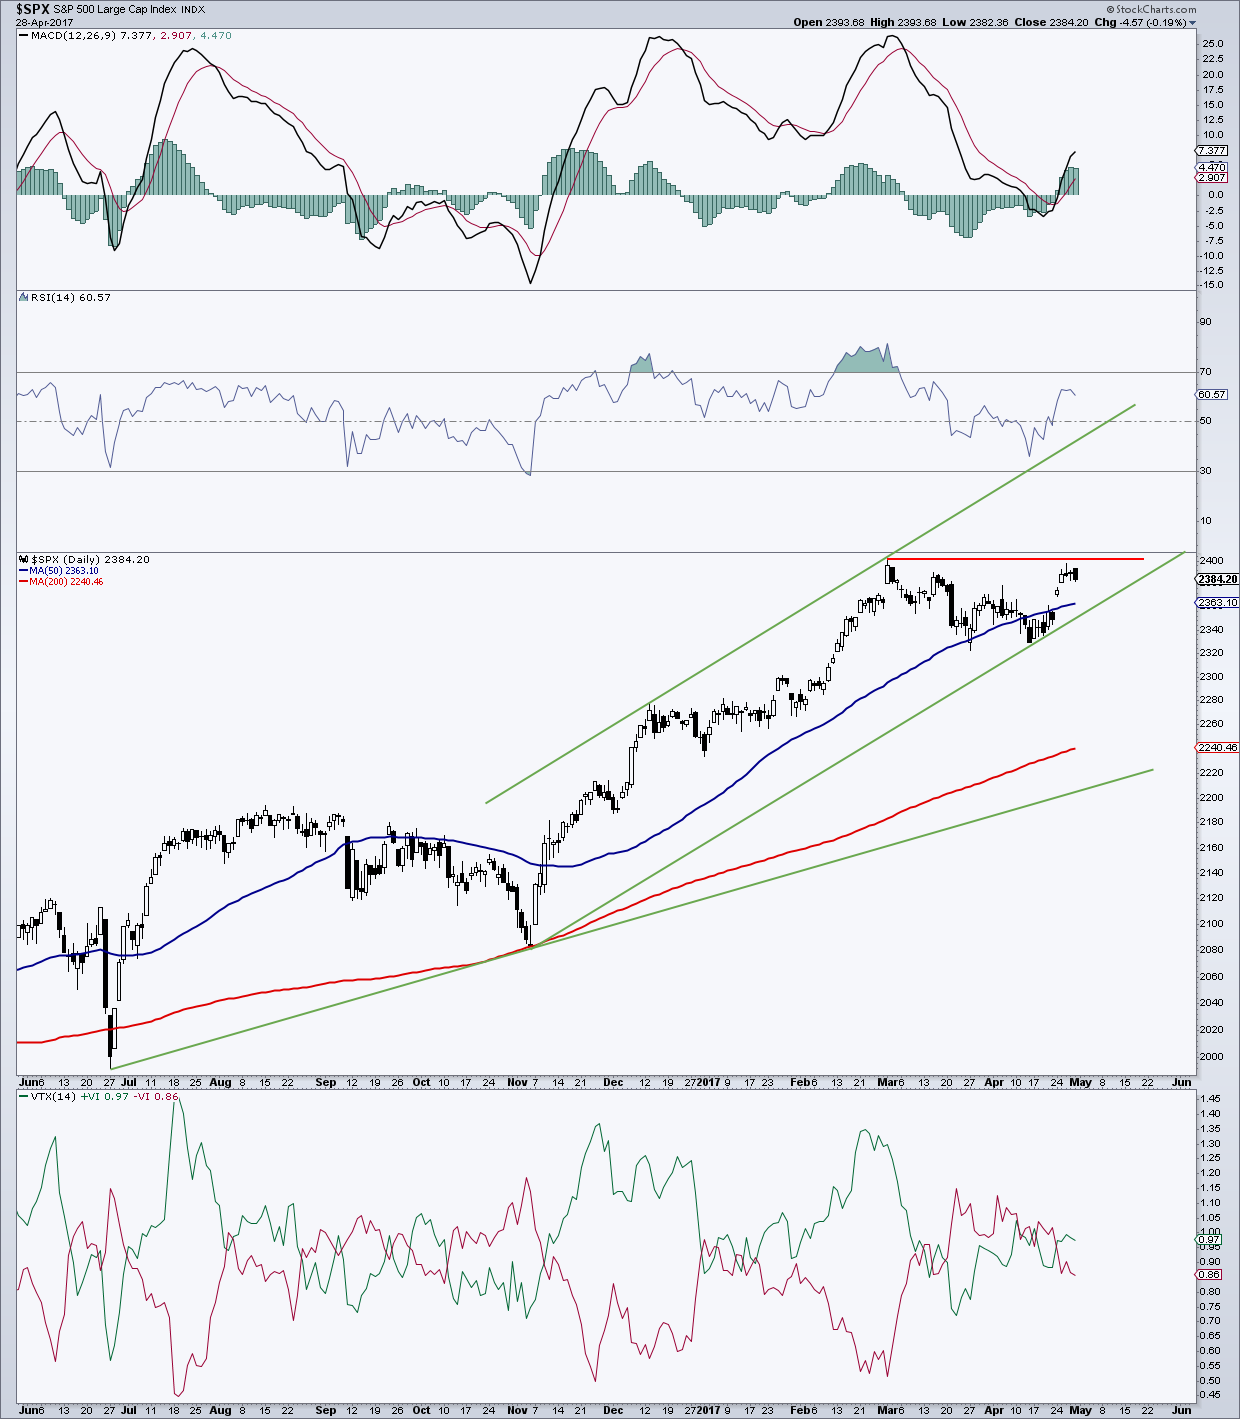
Generally, once a pullback ends, a stock or index will run back up to the old highs (slightly under or over) and pause/pullback. The S&P 500 got as high as 2,398.16 on Wednesday, just shy of its March 1 all-time intraday high of 2,400.98. So in the near term, the market may settle in for a few days and use time to work off some overheated short term overbought signals in momentum. There are a couple of gaps just underneath the index, which may or may not get filled.
The first gap lies between 2,377 and 2,381 with the second gap between 2,356 and 2,369. The lower gap is a breakaway gap and therefore less likely to get filled. Data on Thomas Bulkowski’s site, shows that only 2% of upside breakaway gaps get filled in the first week. Bulkowski also calculated that the average time to close the upside gap in a bull market was 136 days.
Also on his site, he says the best performance from breakaway gaps in a bull market occur when price is already near the yearly high. In addition, breakaway gaps generally are the beginning of a new uptrend in a bull market as it’s a clear sign that the consolidation is complete. Overall, that sounds pretty bullish to me. Personally and the reason I looked this up from someone with statistics is that I never liked the fact that many say all gaps will get filled or must get filled. Why do they need to get filled? If it takes 136 days, is that really a gap fill? Does the market have this kind of memory? Some say it does, while I say it’s a coincidence.
So if the gaps get filled or they don’t get filled on the S&P 500, a market pause/pullback in the near term is most likely to be followed by another thrust higher, well into ATH territory. My ultimate target for the “500” and for this bull market has been the 2,500 area. Bull markets have a way of getting “giddy” at the end so maybe this is a conservative target. Maybe not.
S&P 500 Chart – Breakout now eyes March highs
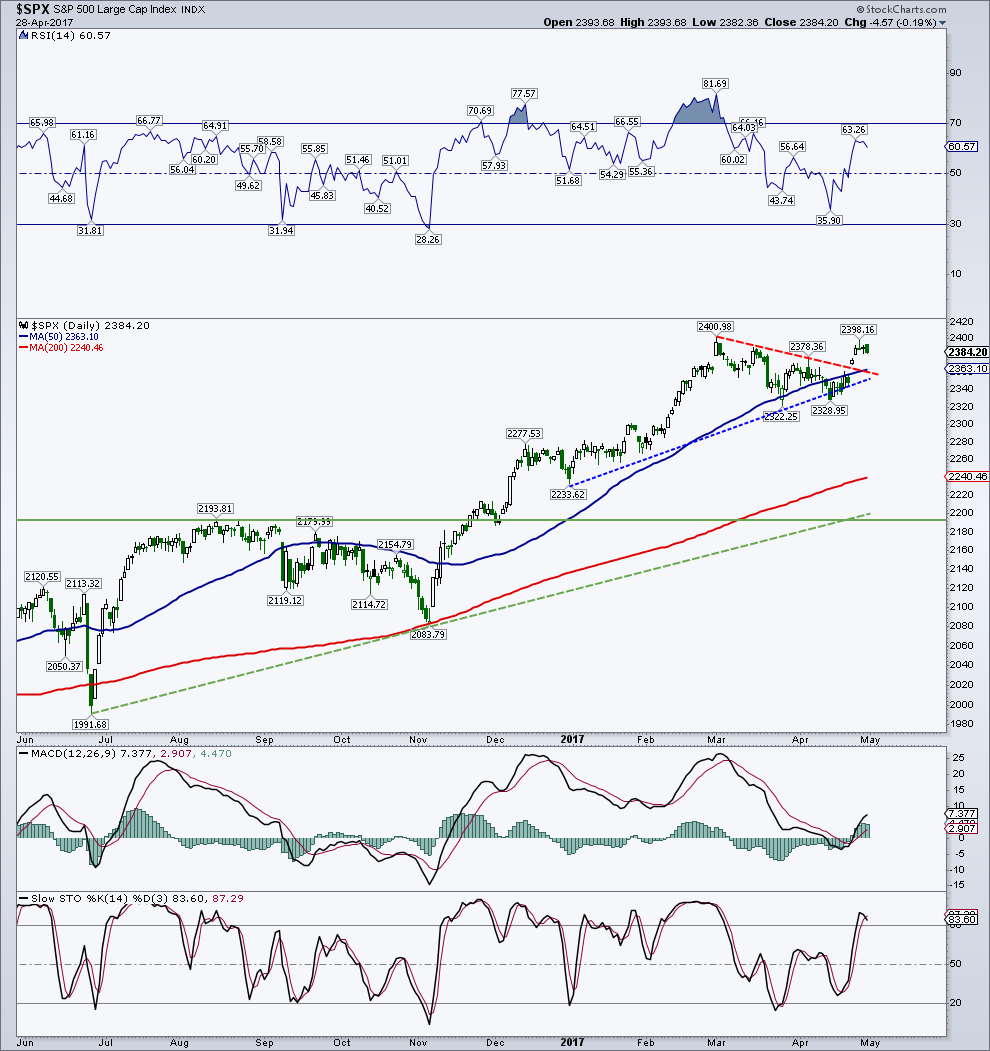
S&P 500 back at the March highs
One of my many technical analysis flaws over the years, which I have conquered, was to stick with one of my targets way too long or after clear evidence showed that it was not going to be met. My targets are based on sound technical tools, but this is a business of forecasting the future, and we all know the how accurate the weatherman is at times. So in my attempt to call the market as accurately as possible, I will let my indicators do the talking instead of pinning my hopes on a simple target.
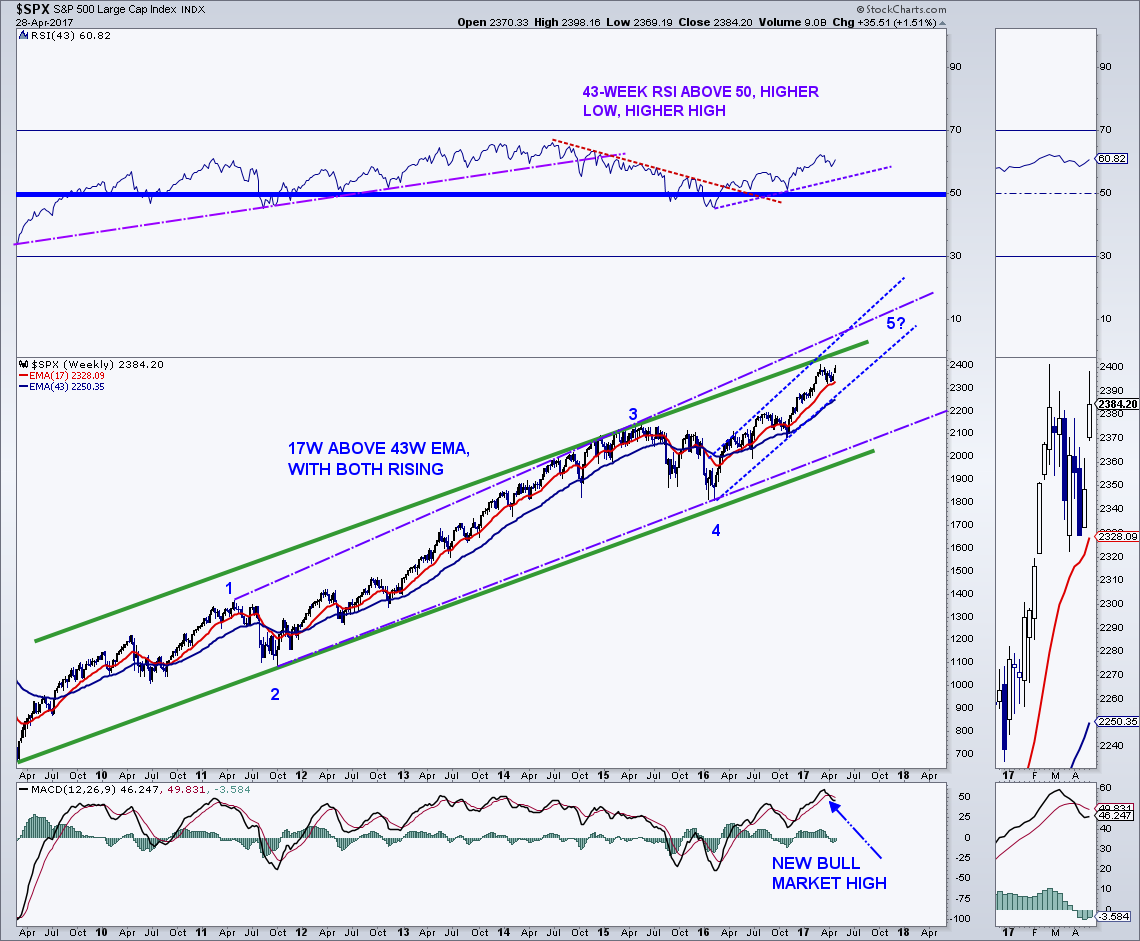
S&P 500 Weekly Chart w/ Elliott Wave Overlay
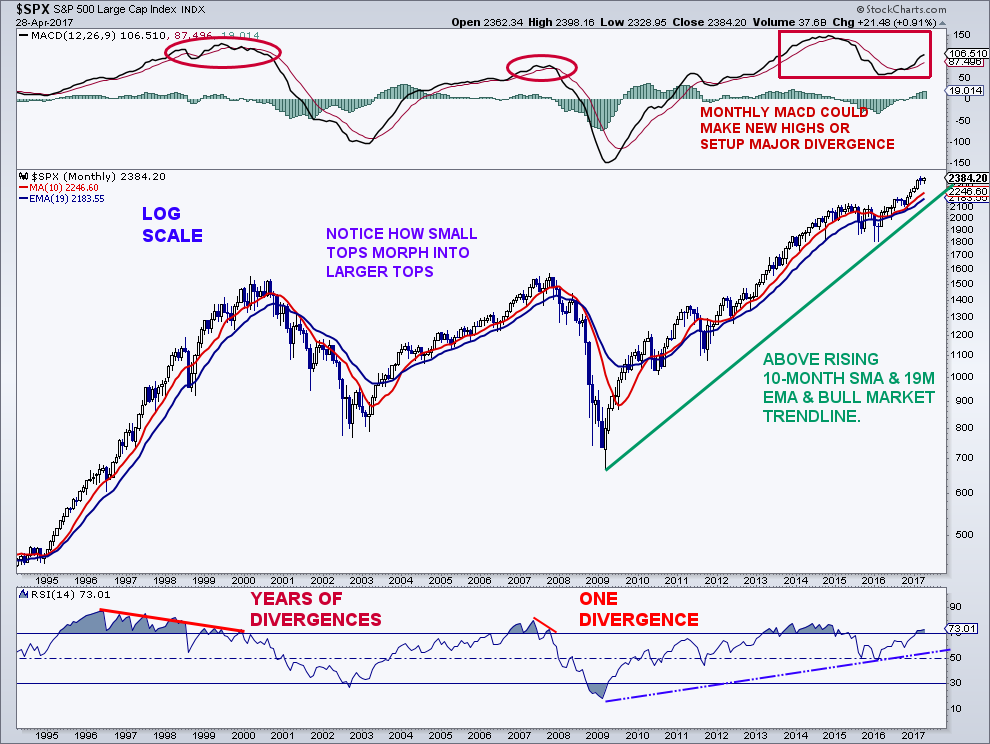
Major market tops are generally accompanied by lengthy divergences with respect to market internals and longer-term (weekly, monthly) momentum as well as extreme optimism from a sentiment standpoint and sometimes, extreme speculation toward one area of the market (remember the biotechs, the housing and financial stocks, the dotcoms and technology stocks, the consumer staple stocks, and the nifty fifty, etc.). Where is that sector right now? I really do not think we have one at this point.
We certainly do not have the ingredients for a major market top when looking at market internals. The common stock-only advance-decline (A/D) line as well as the more traditional A/D line are both hitting new ATHs as we speak. The last couple of peaks in the A/D line were in 1998, mid-2007, and mid- 2015. The last two were months before the S&P 500 peaked, while the ’98 peak was years before the market peaked.
Longer-term momentum does present some issues, as this new high in the S&P 500 has not been confirmed by a new high in monthly momentum. This is certainly something to keep an eye on over the coming months, but right now, it is not a problem as new monthly momentum highs are still a possibility. On a weekly basis, MACD recently made a new bull market high with the 14W RSI almost making a new bull high. This is not a sign of a major top as at least one bearish divergence, if not many, are seen before the final price high.
S&P 500 Monthly Chart
As I said, a little pop in price will do wonders on the sentiment side, especially during a long bull market. This may be related to the Pavlov’s dog study, if you know what I mean. The more times something happens, the more it is expected to happen. Buy The Dip mentality! So in the aftermath of the French elections (really?) the market bolted and the Volatility Index (INDEXCBOE:VIX) absolutely plummeted. I guess many were scared of another Brexit crash.
The VIX proceeded to crumble 26% on Monday, its largest one-day drop since near the bottom of a nasty correction in August 2011. All this on a day that the “500” rose just over 1%. It was a somewhat ludicrous move in option premiums based on the move in the markets for sure.
Conclusion: While we may pause near the old “500” highs of 2,400, the equity markets continue to look bullish, with little sign of the ultimate top in view. Looking out, I see the S&P 500 reaching the 2,500+ region sometime this year.
Feel free to reach out to me at arbetermark@gmail.com for inquiries about my newsletter “On The Mark”. Thanks for reading.
Twitter: @MarkArbeter
Any opinions expressed herein are solely those of the author, and do not in any way represent the views or opinions of any other person or entity.


