Thanksgiving is right around the corner and it remains one of my favorite holidays hands down. On the fourth Thursday of November we get to surround ourselves with family, football, and food. I mean what more can you ask for…
Shockingly there is more, and as investors we should all be thankful. Today we’ll look at the bullish nature of the stock market around Turkey Day. And more specifically, S&P 500 Thanksgiving week seasonality trends.
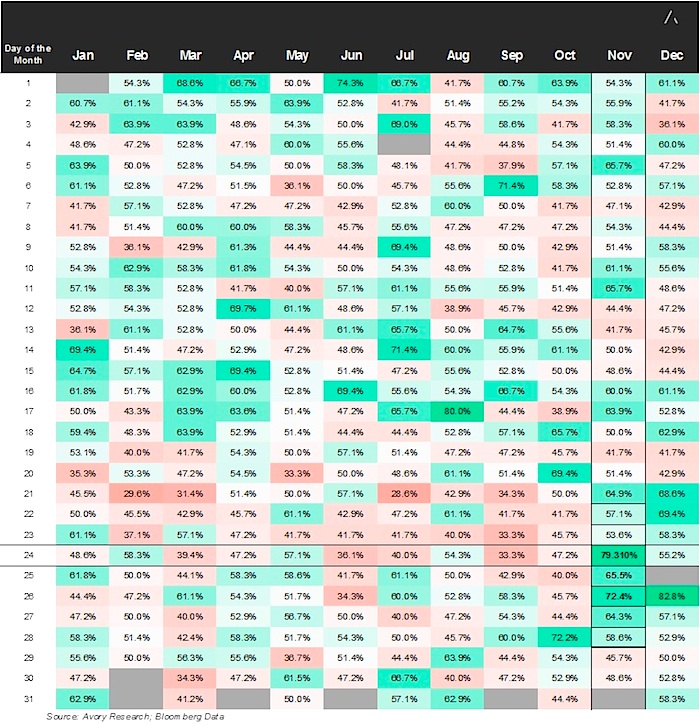
Below highlights 50 years of trading days for the S&P 500 Index (INDEXSP:.INX) and the percent of the time each day has been positive. Instead of looking at a single date, I analyzed all of the historical days in which Thanksgiving has landed on. I found that over the last 50 years, Thanksgiving has landed between the 7 days of November 22nd, and November 28th.
Now let’s be thankful that these 7 days are up on average 64.4%, making these 7 days the best 7 trading days of the year.
Finally here is a quote for the holidays. “When you practice gratefulness, there is a sense of respect toward others.” -Dalai Lama
Thanks for reading.
Twitter: @_SeanDavid
Any opinions expressed herein are solely those of the author, and do not in any way represent the views or opinions of any other person or entity.


