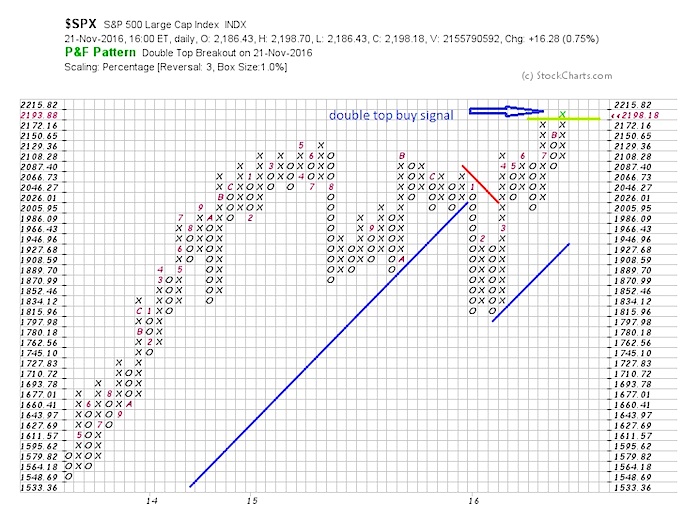
Today I want to take a look at the S&P 500 Index (INDEXSP:.INX) through the lens of Point & Figures charting. This week’s advance triggered a point and figure double top buy signal (bullish), confirming the broader trend higher. Note that this is a “macro” signal; now a short-term trading indicator.
Before we get into the signal and further implications, let’s start from the lower left and work our way to the lower right to discuss what’s happened over the past 2 years.
Looking at the S&P 500 (SPX) chart below, it’s clear that 2014 to early 2015 was a solid uptrend for the index. However looking at August 2015 a sell signal was generated which led to a rather large drawdown in the SPX. After some consolidation the trend line held and multiple buy signals were generated, but the momentum was not strong enough to lead to new highs.
As can be seen early this year January to be specific a triple bottom sell signal was generated that broke the rising trend line and led to another significant drawdown. Analyzing the charts, it looked like the robust bull market was coming to an end, but yet again buyers stepped in and in February of this year the selling subsided to give way to a double top buy signal although within the context of a downtrend. Needless to say the bulls needed to prove themselves. And prove themselves they did as buying drove the market back over 2100 without any meaningful reversal.
As spring settled in, (sell in May and go away) the S&P 500 (SPX) began to see distribution without hitting a new high and also saw sellers take control which led to a double bottom sell signal in June. At this time the SPX had already established a new uptrend so bears still needed to prove themselves. Looking to the month of July (column marked with a seven toward the right of the chart) a new point and figure double top buy signal was generated with momentum continuing until November (column marked with a B) and we saw the SPX give back some gains, but never offering a sell signal. Yesterday the S&P 500 generated another a double top buy signal taking the index to new highs. At this point we can see in addition to confirmation of the recent buy signal the SPX has broken out of its almost two year range and the bull market looks alive and well.
Thanks for reading.
Twitter: @Snyder_Karl
The author may have a position in related securities at the time of publication. Any opinions expressed herein are solely those of the author, and do not in any way represent the views or opinions of any other person or entity.


