Over the last couple of weeks many market folks have noticed the trend of higher lows against a flat ceiling on the S&P 500 Index. Chartists call this an ascending triangle.
What nobody tells you about patterns is that it’s the context of the pattern’s environment that provides insights into where price may be headed next.
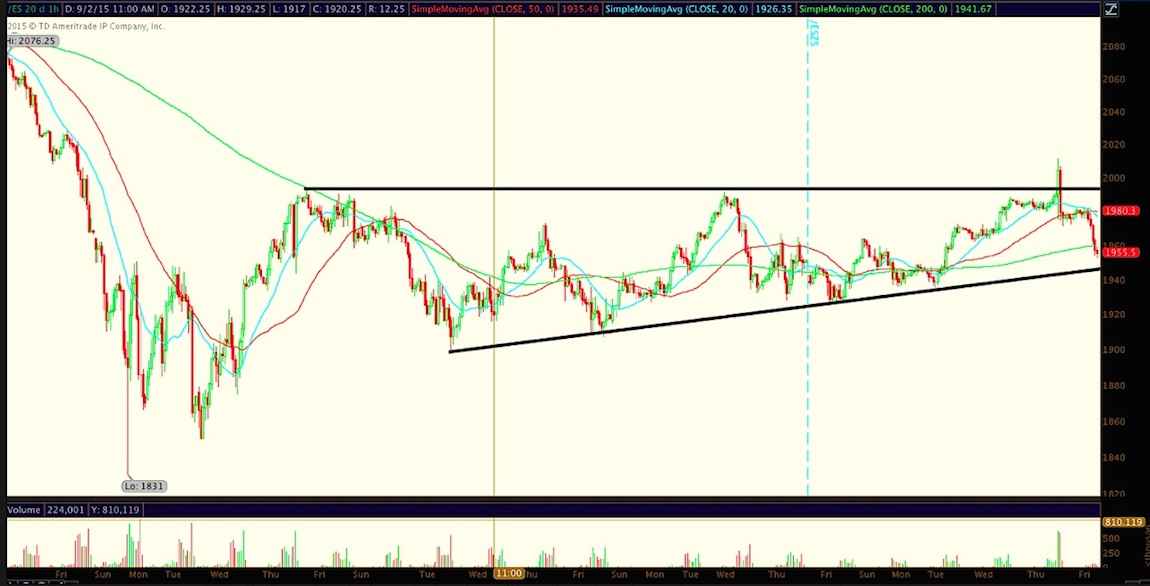
Below is a look at the recent action in the S&P 500 futures, following the broader market selloff.
They call the ascending triangle a continuation pattern. That’s because they are most reliable in the middle of an uptrend. Obviously, that’s not the case over the last few weeks of price action, as price has moved sideways (mostly) after the market selloff.
So let’s try to think of the pattern tactically.
No matter how you cut it, bulls get more impatient in the market and keep buying at higher lows while sellers sell into strength at resistance.
It’s all about the underlying trend and psychology. When we have a market selloff and are in a larger downtrend, shorts set up camp at a certain level they like. People see that and know (roughly) when to stop pushing their luck. The bulls get exuberant and bears pull the rug.
When we’re in a larger uptrend, bulls are driving the boat and folks simply aren’t long enough so prices keep pushing higher.
So, yes, the bears are still holding onto control… and the triangle is what it is: Key areas of psychological support (lower) and resistance (overhead) in the context of a bearish environment (until proven otherwise).
Trade ’em well!
Read more from Aaron on his blog.
Twitter: @ATMcharts
Any opinions expressed herein are solely those of the author, and do not in any way represent the views or opinions of any other person or entity.
: Creating Bullish Divergence?")

 and Semiconductors (SMH): Concerning Price Pattern?")


: Creating Bullish Divergence?")