Broad Stock Market Futures Outlook for May 30, 2018
The lower lows suggested showed up yesterday as traders forced us into deeper support zones. We are bouncing off these levels in a recovery but have stalled in the morning as congestion above shows sellers waiting.
Momentum is mixed and cross-currents abound. Frame your trades with specific attention to risk exposure.
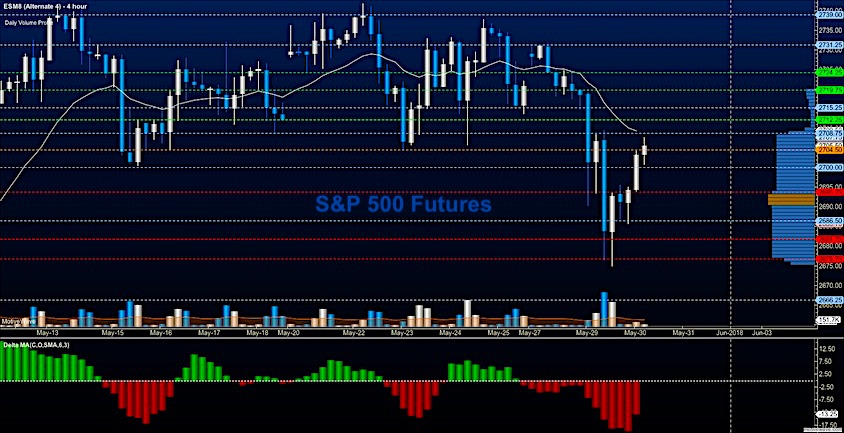
S&P 500 Futures
Lower support tested as bounces stall – Traders need to breach 2704.5 and hold before buyers have any shot at continuation will allow for the press upward into lower resistance, as with yesterday, we moved above the region only to fail and drift lower. This could be the case today as well. This means that we take profit at targets when we see them. The bullets below represent the likely shift of trading momentum at the successful or failed retests at the levels noted.
- Buying pressure intraday will likely strengthen with a bullish retest of 2705.75
- Selling pressure intraday will likely strengthen with a bearish retest of 2698.5
- Resistance sits near 2708.5. to 2714.75, with 2718.75 and 2726.75 above that.
- Support sits between 2695.5 and 2792.5, with 2686.5 and 2677.75
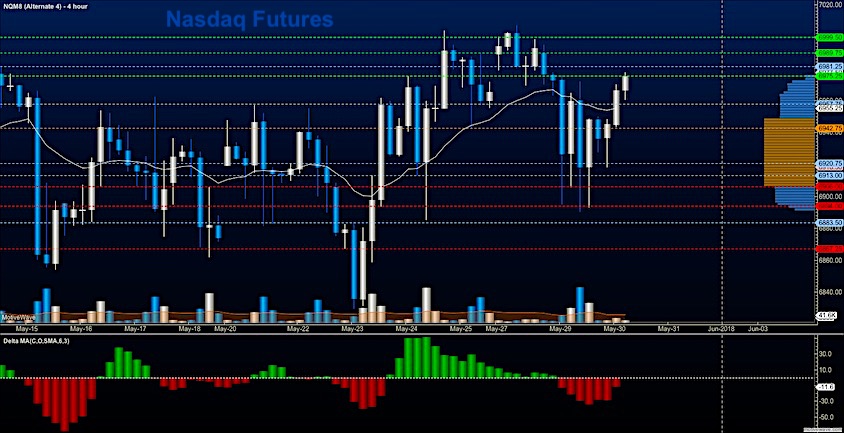
NASDAQ Futures
Stronger rebound shows in this chart as we hold over a major congestion area between 6971 and 6942. Trading will be most choppy inside this range. The bullets below represent the likely shift of trading momentum at the successful or failed retests at the levels noted.
- Buying pressure intraday will likely strengthen with a bullish retest of 6975.75
- Selling pressure intraday will likely strengthen with a bearish retest of 6948.5
- Resistance sits near 6969.5 to 6981.25 with 6989.5 and 6999.25 above that.
- Support sits between 6943.5 and 6932.25, with 6918.75 and 6892.5 below that.
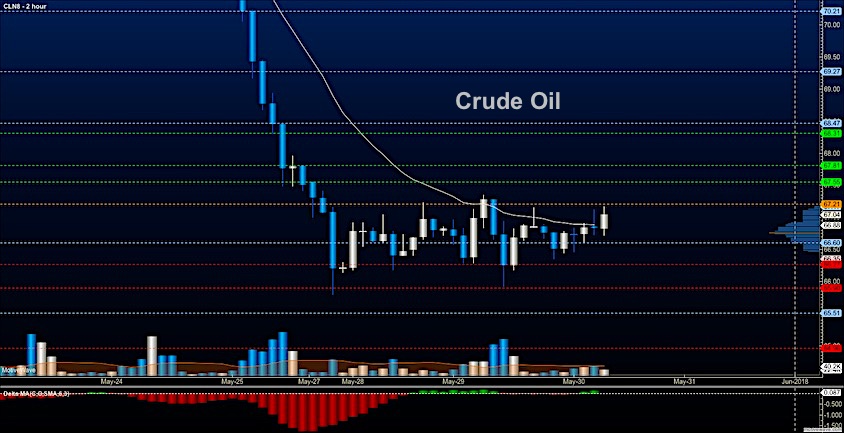
WTI Crude Oil
After two days of basing, traders are attempting to form a bottom. Bounces are still likely to fade into higher support but the selling has significantly slowed near the support zone around 66.27. We did not test the breakout area near 65.57, so I will be keeping an eye on the formations for any significant signals that we could fade again – so far, however, prices appear to be firming up. The bullets below represent the likely shift of trading momentum at the successful or failed retests at the levels noted.
- Buying pressure intraday will likely strengthen with a bullish retest of 67.32
- Selling pressure intraday will strengthen with a bearish retest of 66.71
- Resistance sits near 67.27 to 67.55, with 67.89 and 68.47 above that.
- Support holds near 66.9 to 66.62, with 66.27 and 65.86 below that.
Twitter: @AnneMarieTrades
The author trades stock market futures every day and may have a position in mentioned securities at the time of publication. Any opinions expressed herein are solely those of the author, and do not in any way represent the views or opinions of any other person or entity.

 Testing Important Price Support")
: Cup (and Maybe Handle) Watch")

