December has been depressing and nauseating for stock market bulls.
Though the correction / bear market has felt very controlled (with steady selling), it’s also had several higher opens reverse lower. For much of the month, it’s felt like a one-sided beat down.
And though the recent rally has given bulls breathing room, it didn’t come easy.
Stocks declined sharply on Monday and into Wednesday morning before a sharp reversal higher that marked the biggest one day gains in several years. But today stocks reversed lower again, falling as much as 2.5% intraday… before reversing higher yet again and closing up around 1%.
I have taken some lumps, but my plan for legging into long positions has largely worked out and I’m in good position to lighten up again on this rally.
The Takeaway: It’s far easier to execute during market turmoil when you have a plan. Whether short-term, swing positioning, or long-term…
Okay, let’s look at the daily and weekly charts for the S&P 500.
Note that the following MarketSmith charts are built with Investors Business Daily’s charting suite. I am an Investors Business Daily (IBD) partner and promote the use of their products. The entire platform offers a good mix of technical and fundamental data.
Just yesterday, I tweeted out about the likelihood of a rally into next week:
$SPX Daily buy set up on bar 8 (will complete tomorrow if bar 9 close < 2467.42). Regardless, I’m expecting bounce to hold into next week.
— Andy Nyquist (@andrewnyquist) December 26, 2018
But at the same time, I cautioned about what comes after the rally. Timeframes matter, folks:
Waterfall decline equivalent of momentum wave ($DJIA -4200 / $SPX -450). Lows will likely be retested or undercut in coming days / weeks.
— Andy Nyquist (@andrewnyquist) December 26, 2018
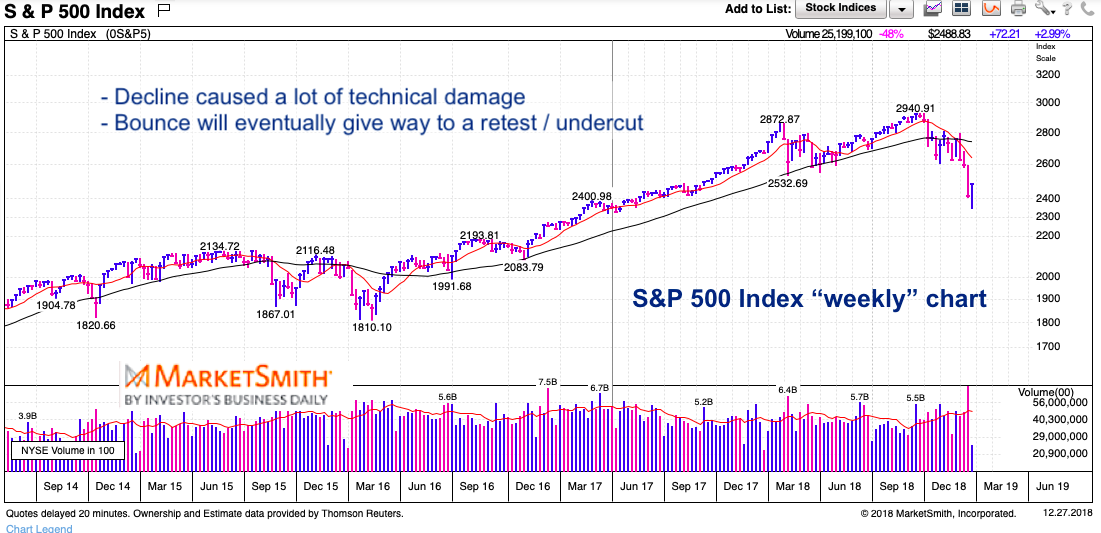
S&P 500 Weekly Chart
The weekly chart is bearish and showing a market that has turned lower. Wednesday’s lows marked a 20 percent correction from the highs, and pushed us down near oversold territory (especially on the daily chart). That likely means that this is a 5-10 day bounce… before a likely turn lower once more.
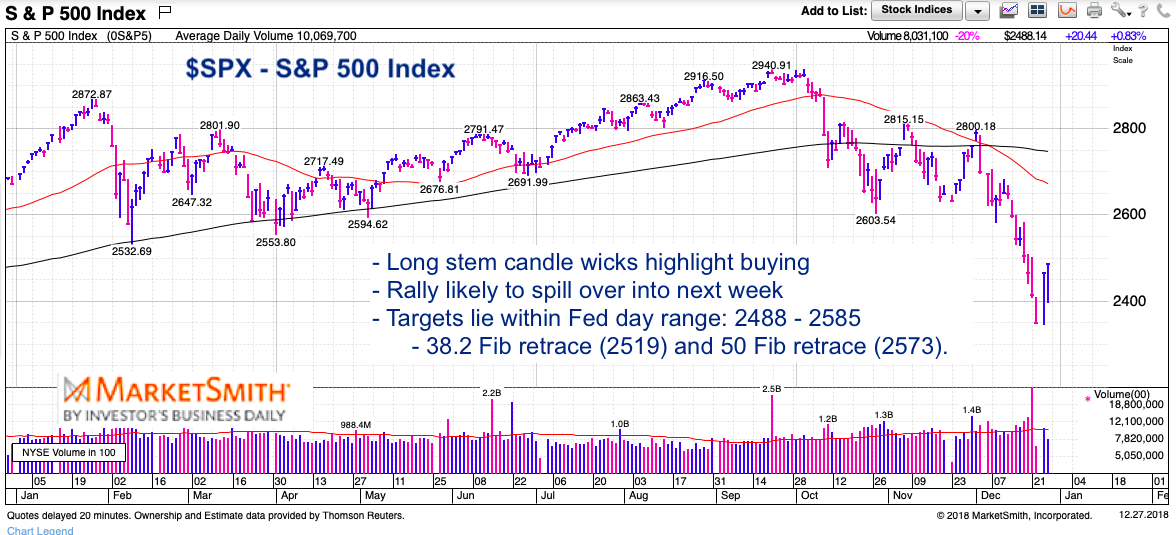
S&P 500 Daily Chart
The daily chart reached deeply oversold levels. Reversals higher on Wednesday and Thursday produced “hammer” candlesticks and have investors feeling better… but we are still 15.4% off the highs!!
The latest waterfall decline has caused plenty of technical damage. With this in mind, the rally will likely fail and we should see a retest or undercut of the lows some time in January. In the meantime, look for the rally to continue into next week with targets of 2519 and 2573 (and 2627 if the rally gets some hops).
Twitter: @andrewnyquist
The author has a long position in mentioned securities at the time of publication. Any opinions expressed herein are solely those of the author, and do not in any way represent the views or opinions of any other person or entity.
: Creating Bullish Divergence?")


 and Semiconductors (SMH): Concerning Price Pattern?")


