S&P 500 Trading Outlook (1-2 Days): Stalling out likely
Stocks will likely stall out between now and Friday.
While there are positive developments structurally and technically, prices have extended now straight higher for 4 consecutive sessions. As well, momentum is overbought with price up to what’s thought to be near important channel resistance just shy of January highs.
While technically this is a welcome development in terms of trend, momentum has now reached overbought levels not dissimilar from stretched levels that were difficult to make much progress from in recent months.
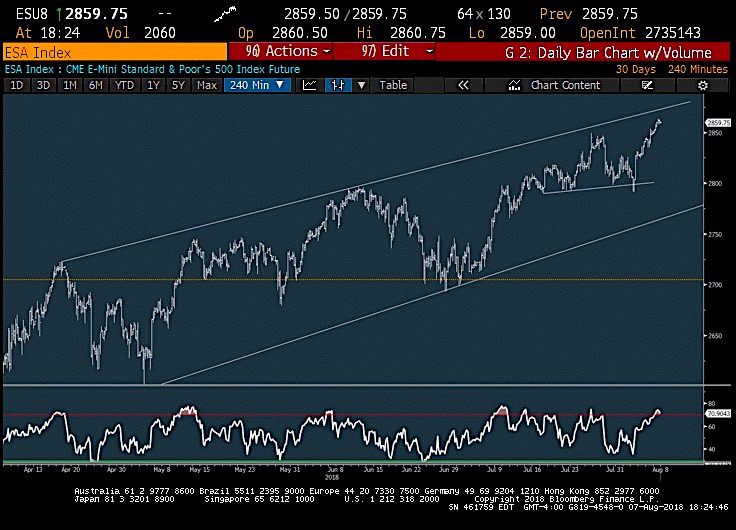
The four-hour chart shows this uptrend channel with prices now having pushed up to hug the highs of the channel, while RSI has registered north of a 70 reading. When looking back, RSI was higher back on July 9, or nearly a month ago, when prices were almost 100 points lower.
While 2864-75 is a possibility, it’s doubtful that prices will get above 2872 before staging at least a minor pullback.
A move under 2835 would be the first sign of a possible pullback and under 2824 would be more negative.
S&P 500 Futures Chart
S&P 500 has pushed to overbought levels, while NASDAQ has not yet exceeded late July highs. It’s tough to be short, but yet prices are within striking distance of January highs and quite overdone near-term, with counter-trend signals on intra-day charts looming. Some type of turn seems likely from 8/8-8/10 given the cycles that hit late this week, while prices have ground higher on minimal breadth. However, given the degree of success in Financials (XLF) and Industrials (XLI) lately, pullbacks likely could prove brief before allowing for additional strength into late August.
Specifically the degree of rally in XLF seemed like a positive with regards to XLF, which has snapped back and broken back out of this pattern to the upside. While the bank ETFs KBE and KRE have not yet joined the XLF in making such a bullish move, this does seem like a positive for this group. Meanwhile XLI also looks to be on the verge of making a similar move between now and Friday. These would both be positive devlopments at a time that Technology has shown less strength than usual, as NASDAQ has not yet broken out and remains below late July highs. So it will be key to balance out the positives of Financials and industrials starting to show better technical patterns in the ETF’s, breaking out above downtrends, vs the fact that US indices have grown stretched after 4 straight days of gains to overbought levels, and in the case of SPX, are right up near upper channel resistance, with RSI levels having gotten stretched.
If you have an interest in seeing timely intra-day market updates on my private twitter feed, please follow @NewtonAdvisors. Also, feel free to send me an email at info@newtonadvisor.com regarding how my Technical work can add alpha to your portfolio management process.
Twitter: @MarkNewtonCMT
Author has positions in mentioned securities at the time of publication. Any opinions expressed herein are solely those of the author, and do not in any way represent the views or opinions of any other person or entity.


")
 Rolling Over At Key Fibonacci Level?")


