Broad Stock Market Futures Outlook
The markets are fading again today as news of more global trade concerns bubble up. Volume is light and trading profiles show lower levels that need some backing and filling after a run higher.
As I have mentioned in recent days, weak bounces often lead to deeper support tests. We are now testing the weekly breakout levels across the major stock indices. See our key trading levels below.
S&P 500 Futures
Buyers continue to struggle as lower highs hold and a deep dip tests lower support overnight. Lower resistance is now 2756 – support levels will become key here. If traders fail to break lower, we’ll begin to hold support and continue a bounce into broken levels above. The bullets below represent the likely shift of trading momentum at the successful or failed retests at the levels noted.
- Buying pressure intraday will likely strengthen with a bullish retest of 2752.75
- Selling pressure intraday will likely strengthen with a bearish retest of 2746.25
- Resistance sits near 2756.75 to 2761.75, with 2766.5 and 2771.75 above that
- Support sits between 2743.5 and 2736.75, with 2731.25 and 2723.75
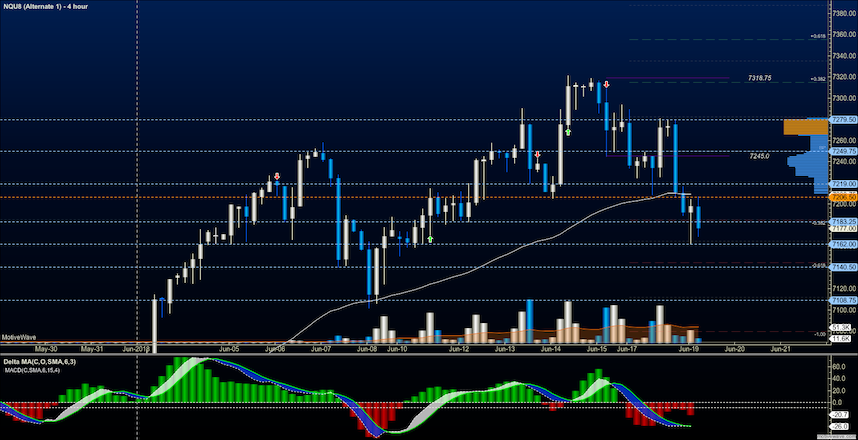
NASDAQ Futures
Traders continue to take profit and watch for support regions to test and begin to hold. Lower support lines tested this morning are near another region of heavy congestion around 7162. The bullets below represent the likely shift of trading momentum at the successful or failed retests at the levels noted.
- Buying pressure intraday will likely strengthen with a bullish retest of 7197.75
- Selling pressure intraday will likely strengthen with a bearish retest of 7172.5
- Resistance sits near 7205.5 to 7219.25 with 7231.5 and 7249.5 above that
- Support sits between 7162.5 and 7151.5, with 7141.5 and 7124 .75 below that.
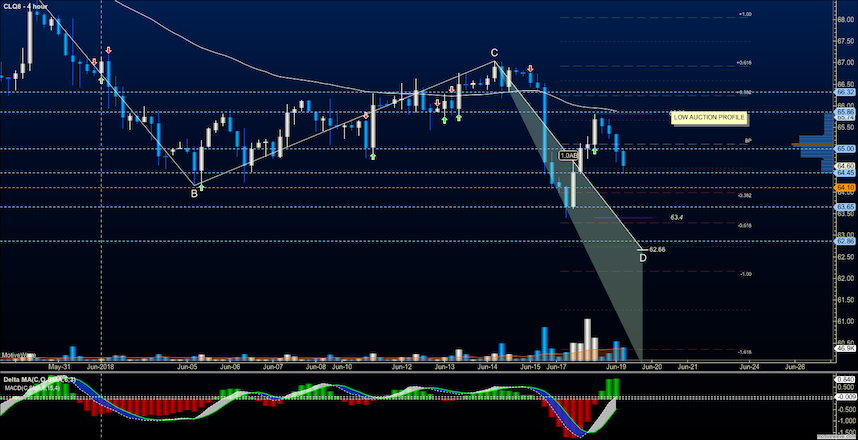
WTI Crude Oil
Bounces held but buyers could not push past the sellers in the spaces defining lower resistance. Support action continues to be important to watch as buyers try to reclaim the upper hand at these value areas of the higher lows presenting this morning. The bullets below represent the likely shift of trading momentum at the successful or failed retests at the levels noted.
- Buying pressure intraday will likely strengthen with a bullish retest of 65.09
- Selling pressure intraday will strengthen with a bearish retest of 64.16
- Resistance sits near 64.78 to 65.31, with 65.76 and 66.12 above that
- Support holds near 64.34 to 63.65, with 63.4 and 62.89 below that
Twitter: @AnneMarieTrades
The author trades stock market futures every day and may have a position in mentioned securities at the time of publication. Any opinions expressed herein are solely those of the author, and do not in any way represent the views or opinions of any other person or entity.


