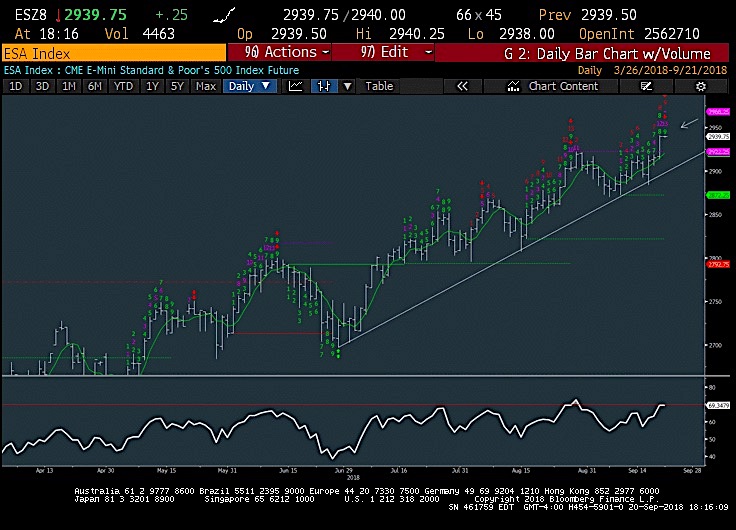
S&P 500 Trading Update (3-5 Days): The S&P 500 Index looks vulnerable here but traders cannot rule out a move up to S&P futures to 2940-5.
Stepping aside from any position here given the divergences and severe dropoff in breadth coinciding with overbought conditions and Demark sells on Daily and intra-day timeframes.
It should be right to sell into this move higher into Friday/Monday, but awaiting evidence of prices failing is the probably best. More precisely, a move under 2921 would confirm a pullback.
Many of the negatives simply have not worked in the last week. And despite the NASDAQ not confirming the S&P 500 and Dow Jones Industrials move, it’s important to wait for the reversal.
Overall, this was not the move expected technically throughout September for U.S. Equities, as both August and September are now within striking distance of both being positive at a very seasonally weak time of the year.
Trends remain very much intact, and have strengthened in recent days, though there are several items of concern that are important to mention.
While not trying to take anything away from the rally, it is a concern that NYSE stocks hitting new 52-week highs has fallen nearly in half over the last three weeks, from 127 to 65. Additionally we’ve seen TRIN levels (ARMS index) pull back to the low 50s as of Wednesday’s close the lowest since January (poor breadth as more stocks were declining than advancing) while the Equity put/call ratio (5 day ma) has dropped also to the low 50’s, indicating nearly twice as much Call buying as Put buying. Finally, the Summation index has dropped down to the lowest levels since May, showing that breadth has fallen off pretty dramatically which Technology weakness was partly responsible for, and stocks like AAPL, FB still show negative MACD and are in downtrends from late August.
As discussed in the Technical Webinar Thursday, none of these matters mean all that much however, as price is the number 1 tool, and trendlines are upward sloping and intact. While these warning signs have successfully given bearish omens about rallies fading historically, it’s a must to see some evidence of price falling to break trends. Trying to get out of stocks to await a correction has never proven smart ahead of the move until trendlines have been violated.
Overall, the important moves yesterday concerned the Dollar decline and the move up in many commodity based stocks which had lagged severely in recent weeks/months. This should be the area to focus on in the weeks ahead.
Twitter: @MarkNewtonCMT
Author has positions in mentioned securities at the time of publication. Any opinions expressed herein are solely those of the author, and do not in any way represent the views or opinions of any other person or entity.


