Early trading has the S&P 500 Index trading back and forth between 2894 and 2902. After Thursday’s move lower, the bulls will need to shore up support.
And the level that pops off the charts is 2894.
Watch if the S&P 500 spends any length of time under 2894.
Even just an HOURLY close could be sufficient and would likely begin a decline to 2883, and possibly a developing decline down to 2861 and 2800-7.
This is the real battleground for today. An important spot near-term.
Let’s look at the HOURLY and DAILY charts.
S&P 500 HOURLY Chart
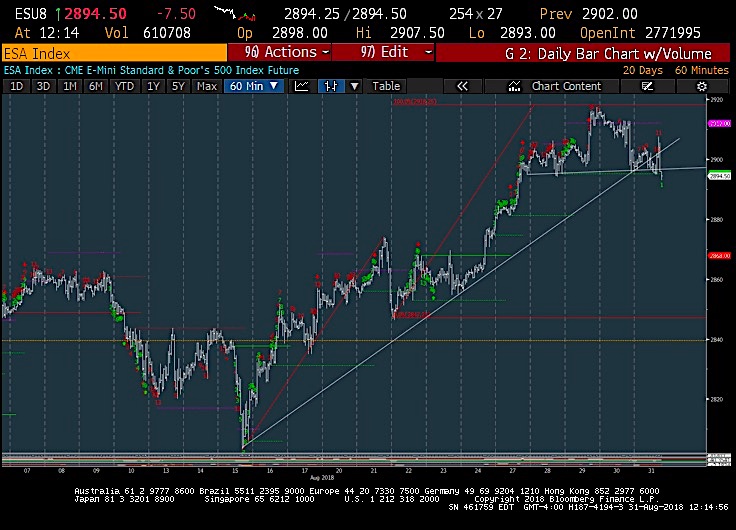
A daily close UNDER 2898 would confirm Demark sells.. and as said above in terms of beginning a potential decline. Could happen today… or perhaps early next week. But watch 2894.
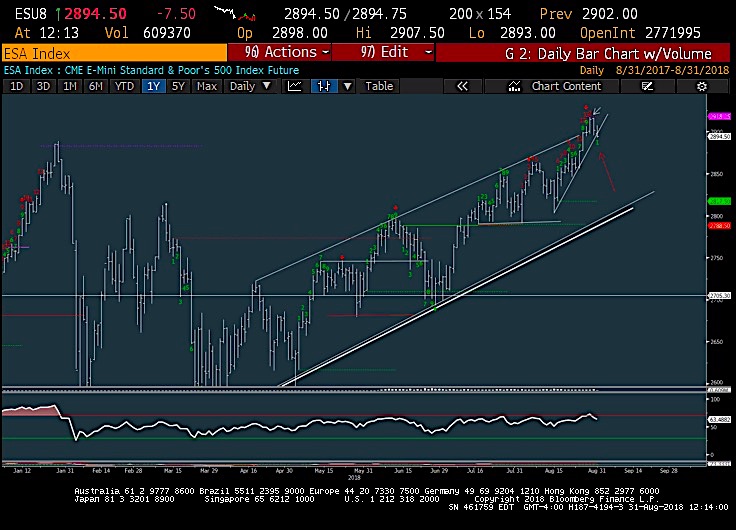
S&P 500 DAILY Chart
If you have an interest in seeing timely intra-day market updates on my private twitter feed, please follow @NewtonAdvisors. Also, feel free to send me an email at info@newtonadvisor.com regarding how my Technical work can add alpha to your portfolio management process.
Twitter: @MarkNewtonCMT
Author has positions in mentioned securities at the time of publication. Any opinions expressed herein are solely those of the author, and do not in any way represent the views or opinions of any other person or entity.


")


 Ready To Break Out?")