“The faster she slides, the faster she can get up.”
As many long-time readers know from years and years of my commentary, the faster the market goes down, the faster a bottom can be traced out. This corresponds to pullbacks and corrections in bull markets and market crashes, but not your extended bear market.
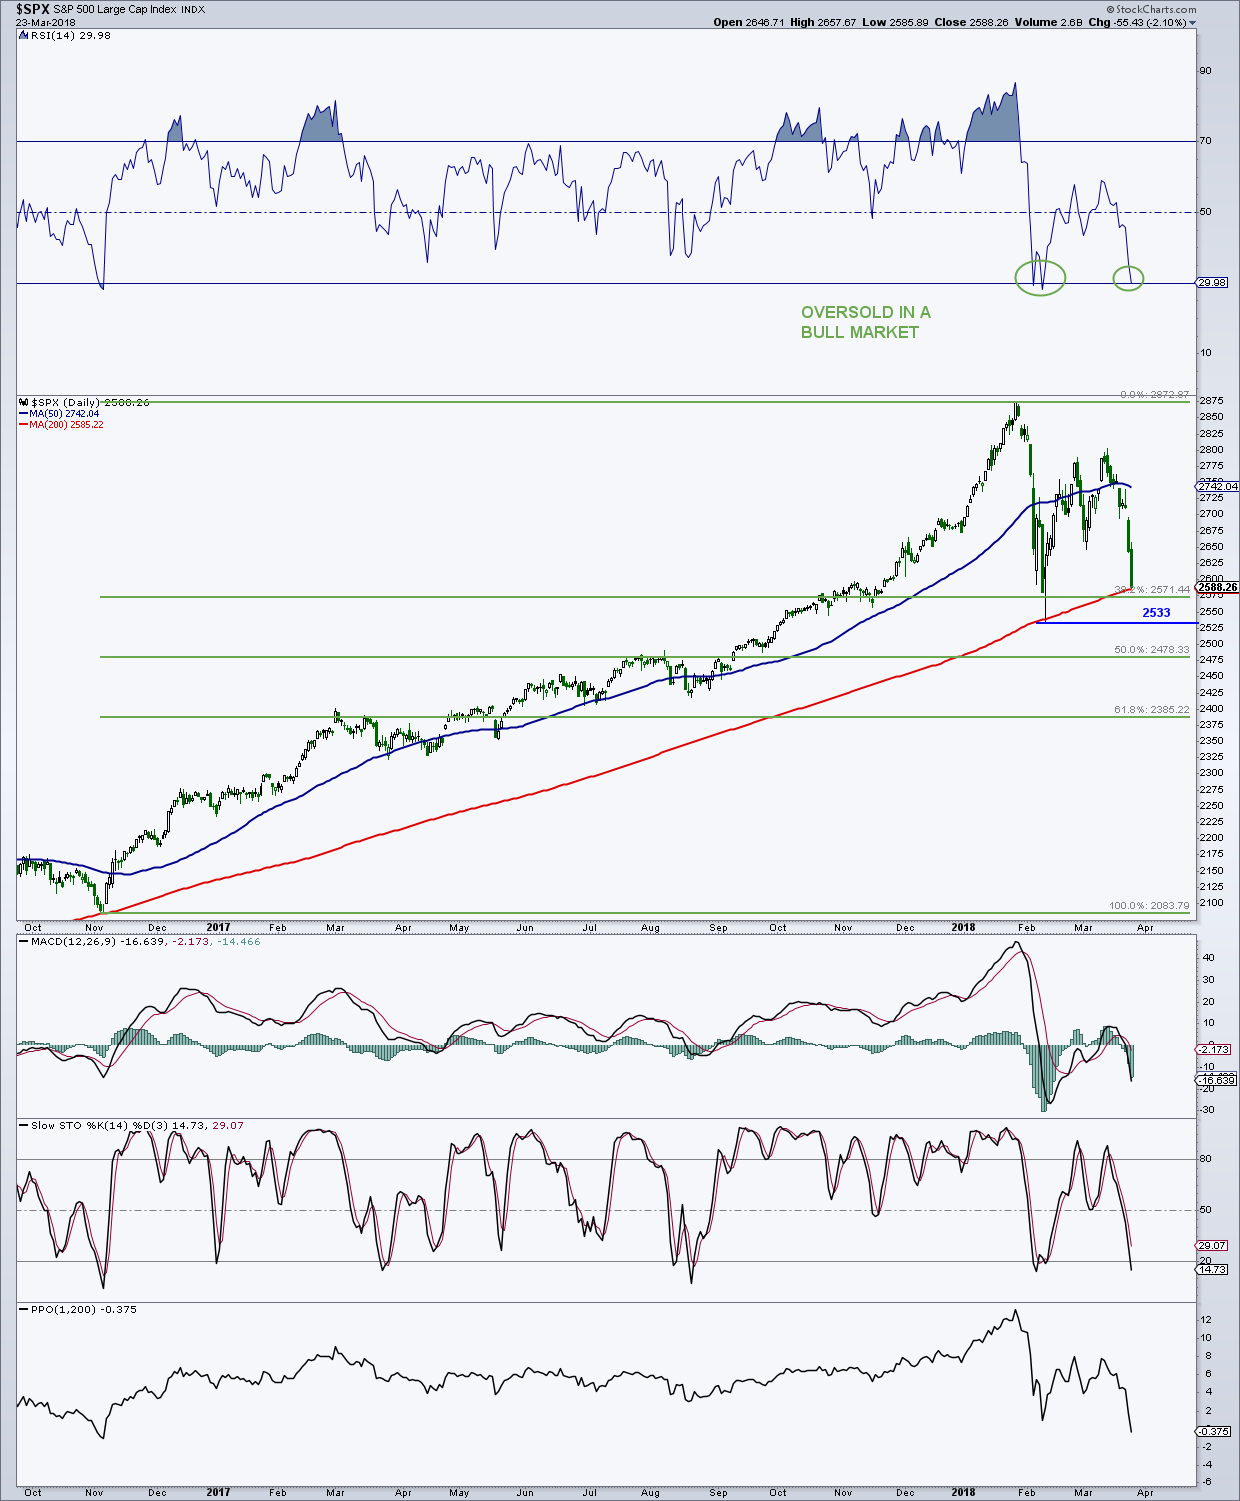
On Friday, the S&P 500, in my book, officially retested the closing low from early February finishing at 2,588 vs. the 2/8 close of 2,581. The index also finished right at its rising 200-day average. The index is once again oversold in a bull market on a daily basis, and typically, these are the times to hold the nose, close the eyes and buy.
The likelihood of a volatile Monday is probably pretty high with the perma bears calling for a crash and the perma bulls saying this is a great buying opportunity. The eventual outcome still favors the bulls, but the road is likely to remain rocky for a little longer. The absolute best price action early next week would be a flush down to or below the intraday low from Feb. 9 at 2,533. This would then be followed by a quick reversal and a failed breakdown.
I will say that any action that stays below 2,533 for longer than 3 – 5 days could be very concerning. There are some targets below that level that may represent the bottom for this correction. If this is a 3 wave or ABC decline, a measured move (assuming A = C) targets the 2,462 area.
This is not far from a 50% retracement of the rally since the November 2016 low. If the market is higher from the opening on Monday we will need to see some strong upside follow-through in the days ahead to suggest the worst is over.
S&P 500 “Daily” Chart
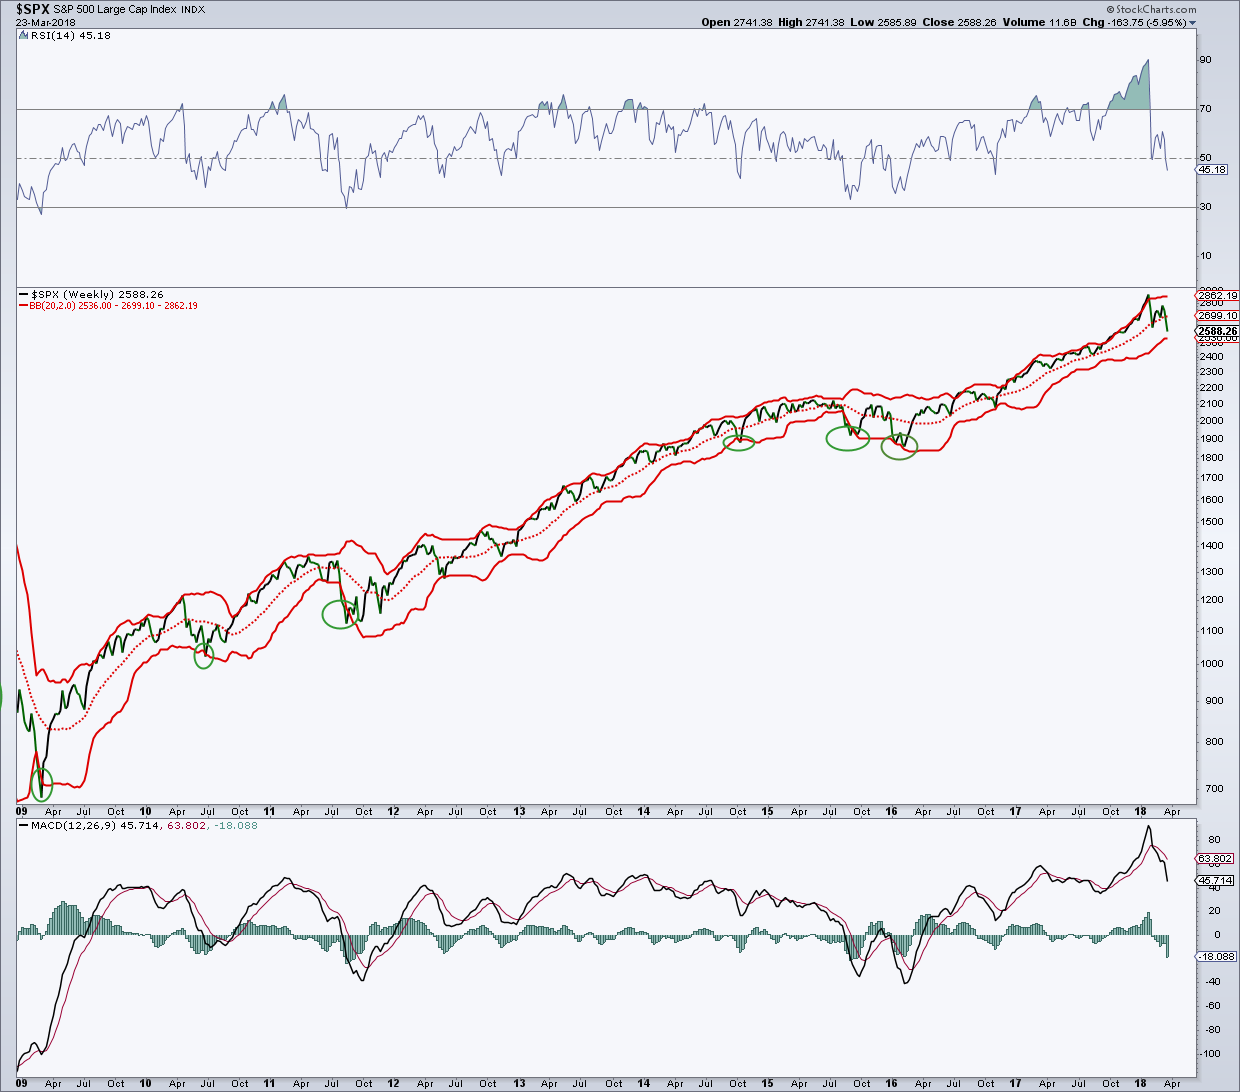
On the weekly chart of the S&P 500 with Bollinger Bands (BB), we can see that the index has broken the middle line or 20-week moving average. Many times on a break of the mid-line, the index will go down to the lower band or slightly undercut the lower band which is interestingly at 2,536 or right near the intraday low.
In the current bull market, touches or undercuts of the lower BB have been THE best times to buy the market. Once again, a break of the lower band for an extended period would represent a change in character of the market and warrant caution – not something I am looking for.
S&P 500 “Weekly” Chart
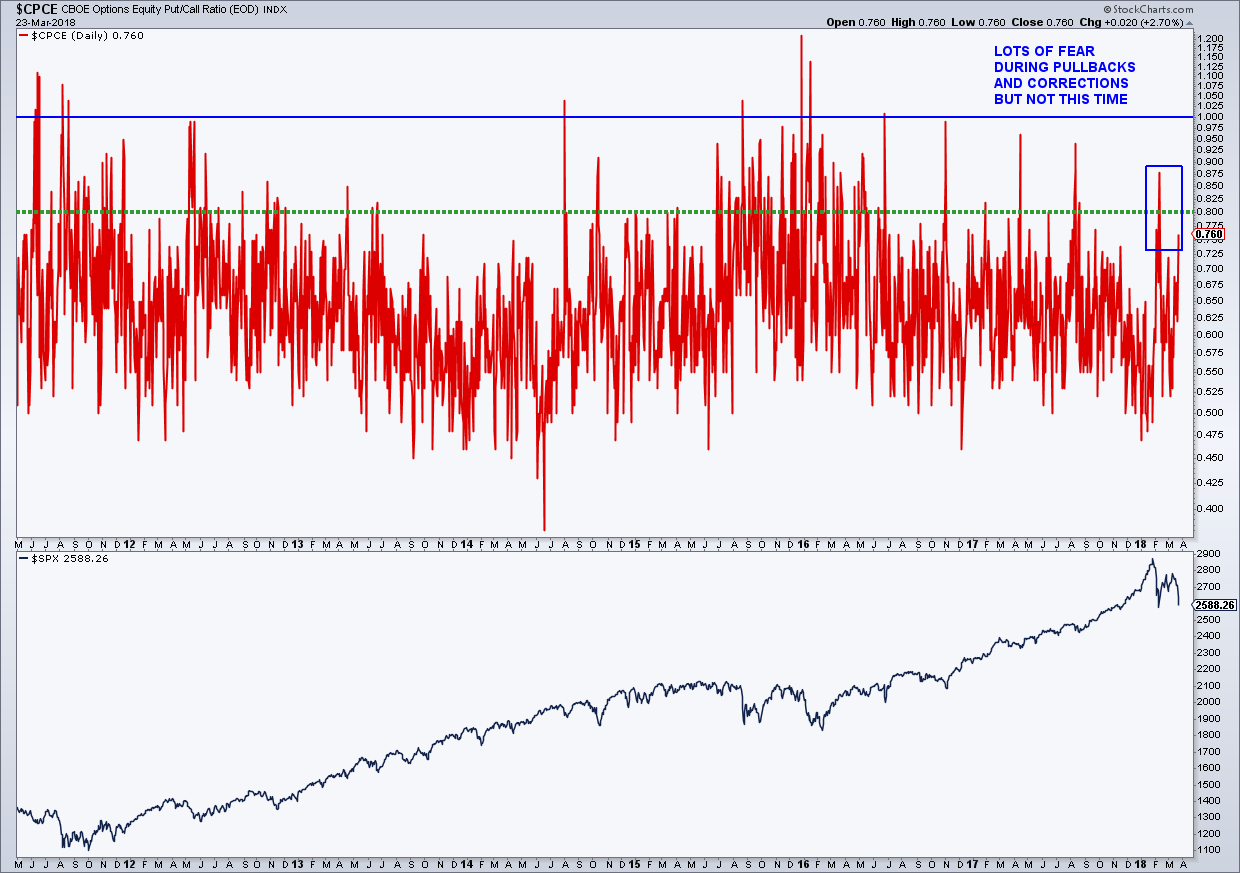
Sentiment: There was a very healthy CBOE total put/call ratio on Friday. This was the first since the correction started. The p/c was 1.54 on Friday, the highest and most fearful reading since August 2015, right near the first low of that correction.
Unfortunately, AND STILL CONFUSING, we have yet to see any decent fear in the equity-only p/c ratio. I looked back as fas as I could (about 20 years) and the only time we did not see a big jump in this p/c during a decent sized pullback or correction was early 2010 when the “500” dropped 8%. Quite honestly, I really do not know what to make of it. I guess its possible that investors are using negatively leveraged ETF’s to short/hedge their portfolios instead of buying puts on individual stocks.
BREADTH: All the A/D lines remain in uptrends although there has been some deterioration. If a bear market was coming, I would have expected some weakness/divergences late last year/early this year. The A/D lines suggest that the highs have not been seen.
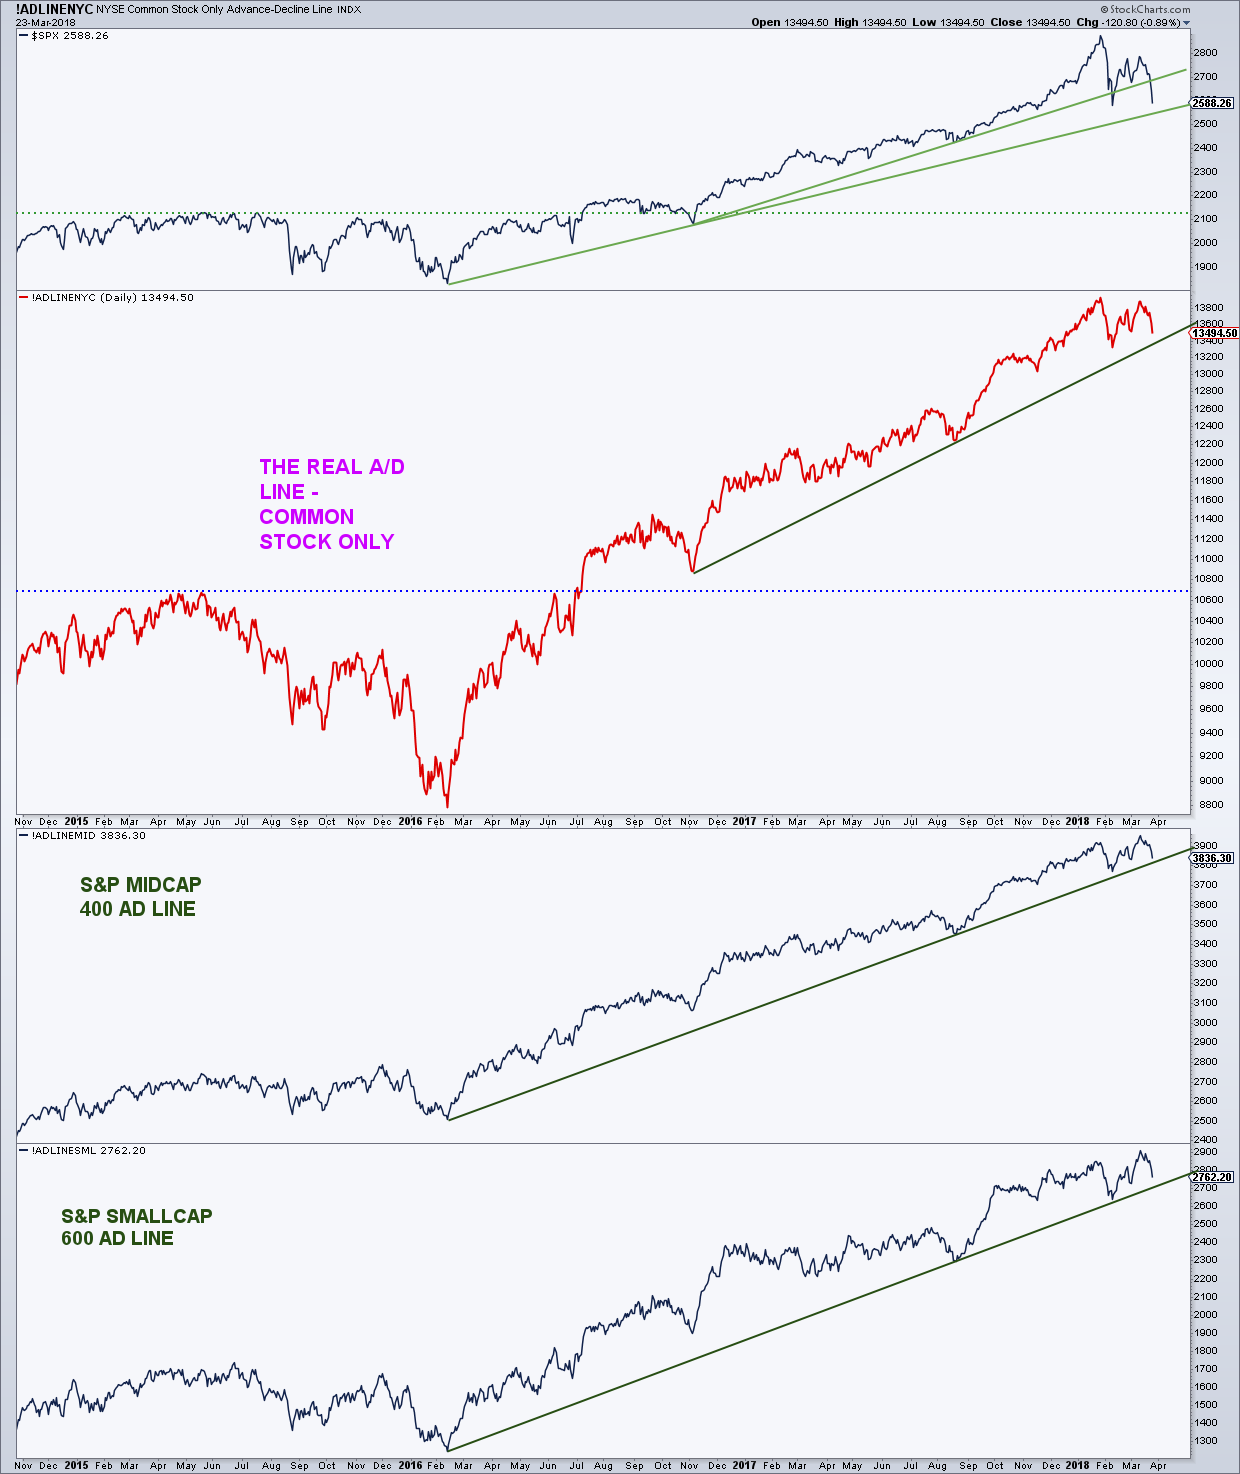
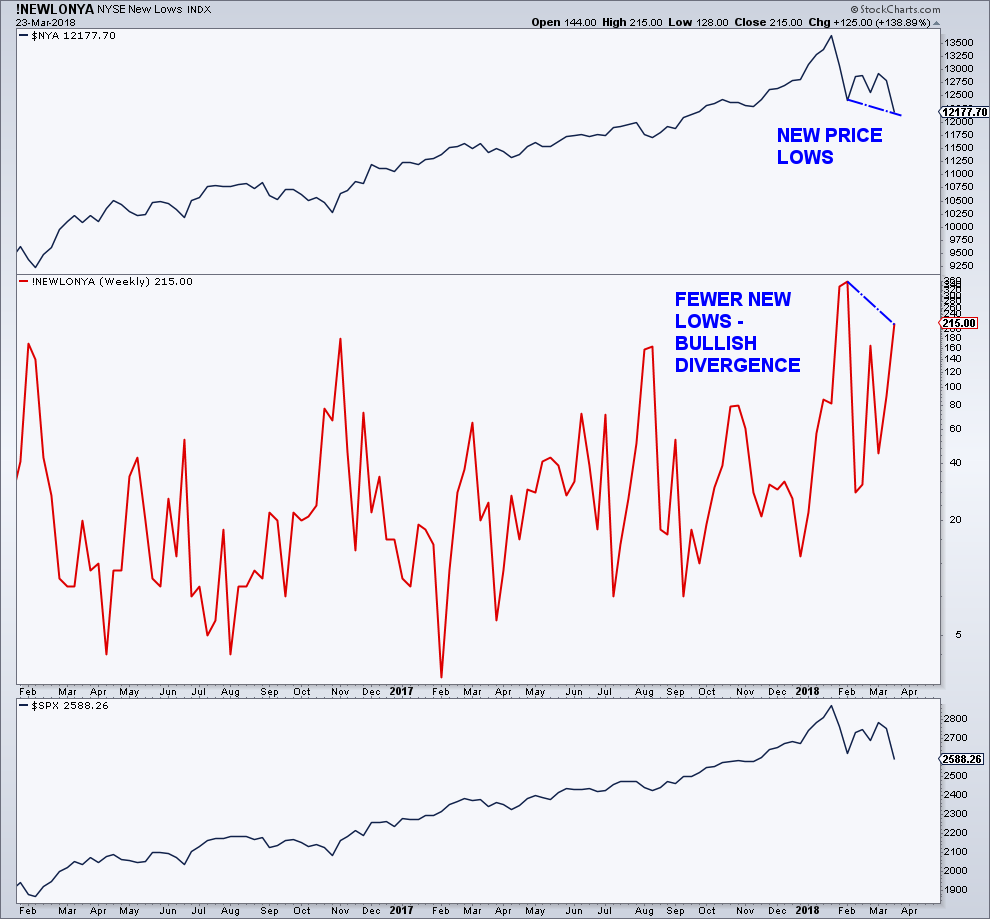
New price lows for the NYSE Composite (NYSE), but fewer new NYSE 52-week lows = Bullish Divergence.
At or near major lows, you want to see bullish divergences with respect to breadth indicators. The last major divergences were at the 2015/2016 lows.
Could this be another correction in an ongoing bull market?
continue reading more on the next page…


