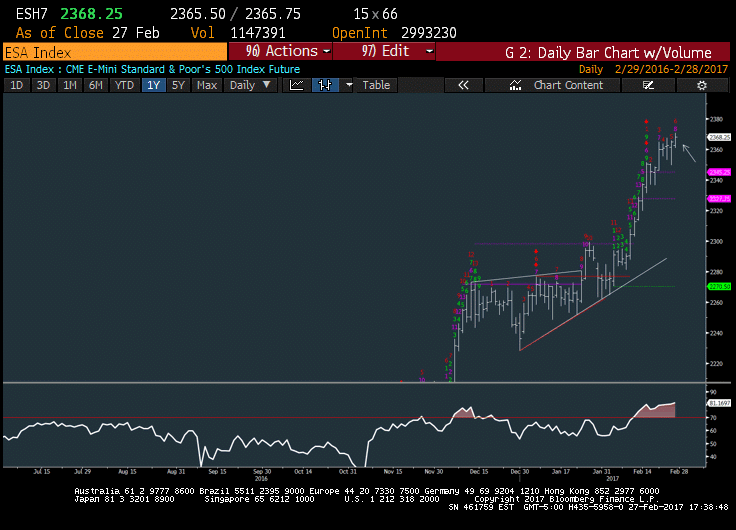
S&P 500 Futures: (2-3 Days)- Upside likely limited to 2375. The S&P 500’s (INDEXSP:.INX) move back to new intraday and closing highs could allow for brief upside into 2375 into early March, but I’m hesitant to think much more upside is possible.
It’s tough taking a real bullish stance here as upside could prove brief, but would look to sell into gains at 2374-6 on S&P 500 futures, then use movement under 2349 as a signal that a pullback is underway.
The S&P 500 extended gains once again yesterday, seemingly lifting out of this consolidation which had held prices range-bound for the last five trading days. That said, Technology, Industrials, and Financials have not yet lifted back to new highs, and this is something to watch for in the days ahead (as to their relative success or failure). On the downside, traders should watch last Friday’s lows for evidence that this move might be false and take prices back down below 2349.50.
S&P 500 Futures Chart
TECHNICAL THOUGHTS
The stall out over the last five trading days failed to lead to any real downside. Both pullback attempts on Thursday and Friday of last week proved short-lived and snapped back to close nearly unchanged (and well off the lows). Yesterday’s gains then lifted prices back to new intra-day and closing highs but on market breadth gains of merely 3/2 positive.
The Dow Jones Industrials notched its 12th consecutive gain for the first time since 1987. Energy finished as the only sector to close up more than 0.50% while the Defensives backed off and weakened as Treasury yields rose marginally. Overall, while this price action will eventually be corrected, it’s tough making too much of this index price action as toppy, or stalling out based on overbought conditions alone. While the individual sectors have shown some signs of wear of late, the indices have not yet reflected that. We will need to see at least some evidence of prices turning back down to lows before getting too negative.
One sector which continues to show impressive gains and snapback from last year’s severe weakness is Healthcare (NYSEARCA:XLV), and in particular Biotech (NYSEARCA:XBI). On Monday the sector vaulted back over prior highs to the highest levels since early last year. Additional gains look likely to near 72, maybe 73, but shouldn’t have too much more upside before stalling out. The weekly chart is showing some minor evidence of exhaustion. For now, the Healthcare ETF (XLF) also looks to be closing in on a more serious level of resistance, which is intersected from 2015 highs connecting last year’s highs. In the near-term, Biotech looks to still be a sub-sector to favor for a little more follow-through this week after Monday’s gains.
Elsewhere, treasury bond yields backed up on Monday, while Crude oil finished above $54. Gold flirted with early gains before finishing down as the Dollar rallied throughout the session. Energy stocks led all other sectors with Oil Services (OIH) showing nearly a 2% gain in trading. While as reported early Monday morning in the Weekly Technical Perspective about the prospect for Energy gains looking promising, additional headway looks necessary before one can call the OIH move a breakout, even in the short run. The trend from mid-December intersects near $34.21, which will be necessary to exceed to give this ETF a chance to extend. For now, the Energy Sector (XLE) looks to potentially be a better risk/reward than OIH, but the key point is that Energy should begin to turn back up higher – it looks to be an attractive risk/reward to overweight from a technical counter-trend perspective.
Thanks for reading.
Note that you can catch more trading ideas and market insights over at Newton Advisor. Thanks for reading.
Twitter: @MarkNewtonCMT
Any opinions expressed herein are solely those of the author, and do not in any way represent the views or opinions of any other person or entity.


