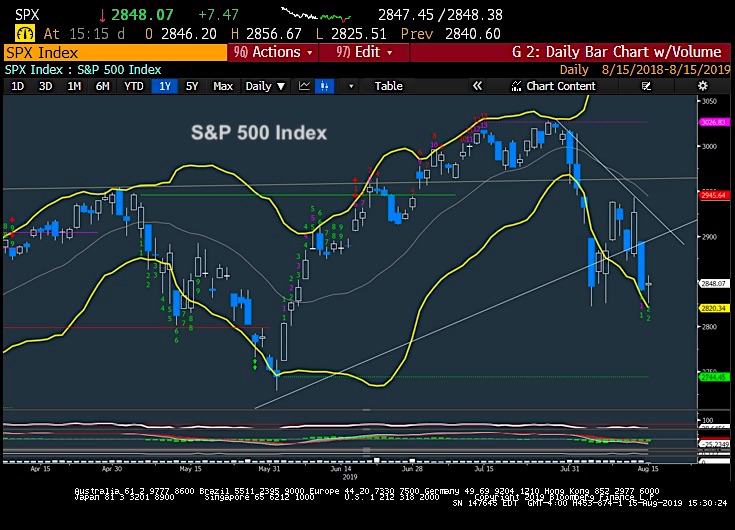
S&P 500 Index Chart INDEXSP: .INX
The S&P 500 is trying to bounce here. Though I expect stocks to follow bond yields a bit lower into next week before a bottom, keep an eye on key price levels here.
S&P 500 Index Trading Outlook (3-5 Days): Bearish
S&P 500 key price support levels: 2775, then 2735
Yesterday’s early rally held the key 2870 resistance before turning down, but yet a minor rally into the close fails to help this chart too materially.
It’s still thought that markets might show volatility Friday into next Monday. As mentioned above, the majority of yesterday’s strength happened in the Defensives and given a couple 50 point swings for SPX, seeing an 8 point S&P gain on the day doesn’t give one much conviction after having lost 86 points the prior day.
Overall, closing up over 2870 needed to have any confidence of a larger bounce. For now, Demark exhaustion is very much premature on 180 and 240 minute charts and structurally patterns remain weak. Pullbacks to 2775 and then 2732-5 look likely before any real low is expected.
Market Commentary
Yesterday’s minor bounce doesn’t do much to change the larger pattern and S&P 500 remains bearish with negative slope, trend and momentum and could still face weakness down to challenge early August, if not June lows before any low is at hand.
Market breadth finished flat on the day, while S&P managed to recoup just a fractional amount of the prior days 80+ points lost.
Given that Equity put/call has not yet moved back to highs and there remains a lack of Demark based exhaustion at recent lows, it’s tough to make a compelling case for buying dips just yet. The tendency for Equities to follow Bond yields has been ongoing of late, and yesterday wasn’t any different. The early decline in Equities happened after yields plummeted and then rallied later in the day as yields snapped back. While yields are oversold on weekly and monthly charts, we dont’ yet seem to be at levels where yields turn up right away. Thus, a bit more weakness is likely and equities likely follow suit.
Looking back, it was largely Defensives that led performance yesterday, NOT Technology, Discretionary or Industrials which were all down. These Defensive groups have led performance now for the last three months, outperforming Technology, so this is certainly not a new phenomenon. Utilities currently is the second best performing group over the last six months. Until these groups start to give way and roll over, it’s unlikely that stocks experience much of a meaningful rally that can be trusted.
If you have an interest in seeing timely intra-day market updates on my private twitter feed, please follow @NewtonAdvisors. Also, feel free to send me an email at info@newtonadvisor.com regarding how my Technical work can add alpha to your portfolio management process.
Twitter: @MarkNewtonCMT
Author has positions in mentioned securities at the time of publication. Any opinions expressed herein are solely those of the author, and do not in any way represent the views or opinions of any other person or entity.

: Showing Some Signs of Emerging Strength")
