The Chaikin Power Bars show us that Utilities (XLU), Health Care (XLV) and Technology (XLK) are the top three S&P 500 (SPY) sectors of the market.
On the other side of the ledger, we have Materials (XLB), Consumer Staples (XLP) and Energy (XLE) in the bottom three.
Note that the Power Bar Ratio is a measure of how many stocks in each sector are Bullish, Neutral or Bearish based on Chaikin’s 20-factor model for rating stocks.
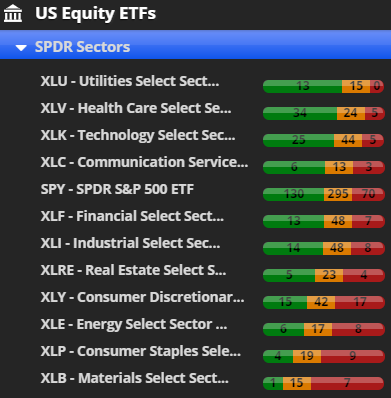
You can gain more insights into our methodology and stock picking over at Chaikin Analytics.
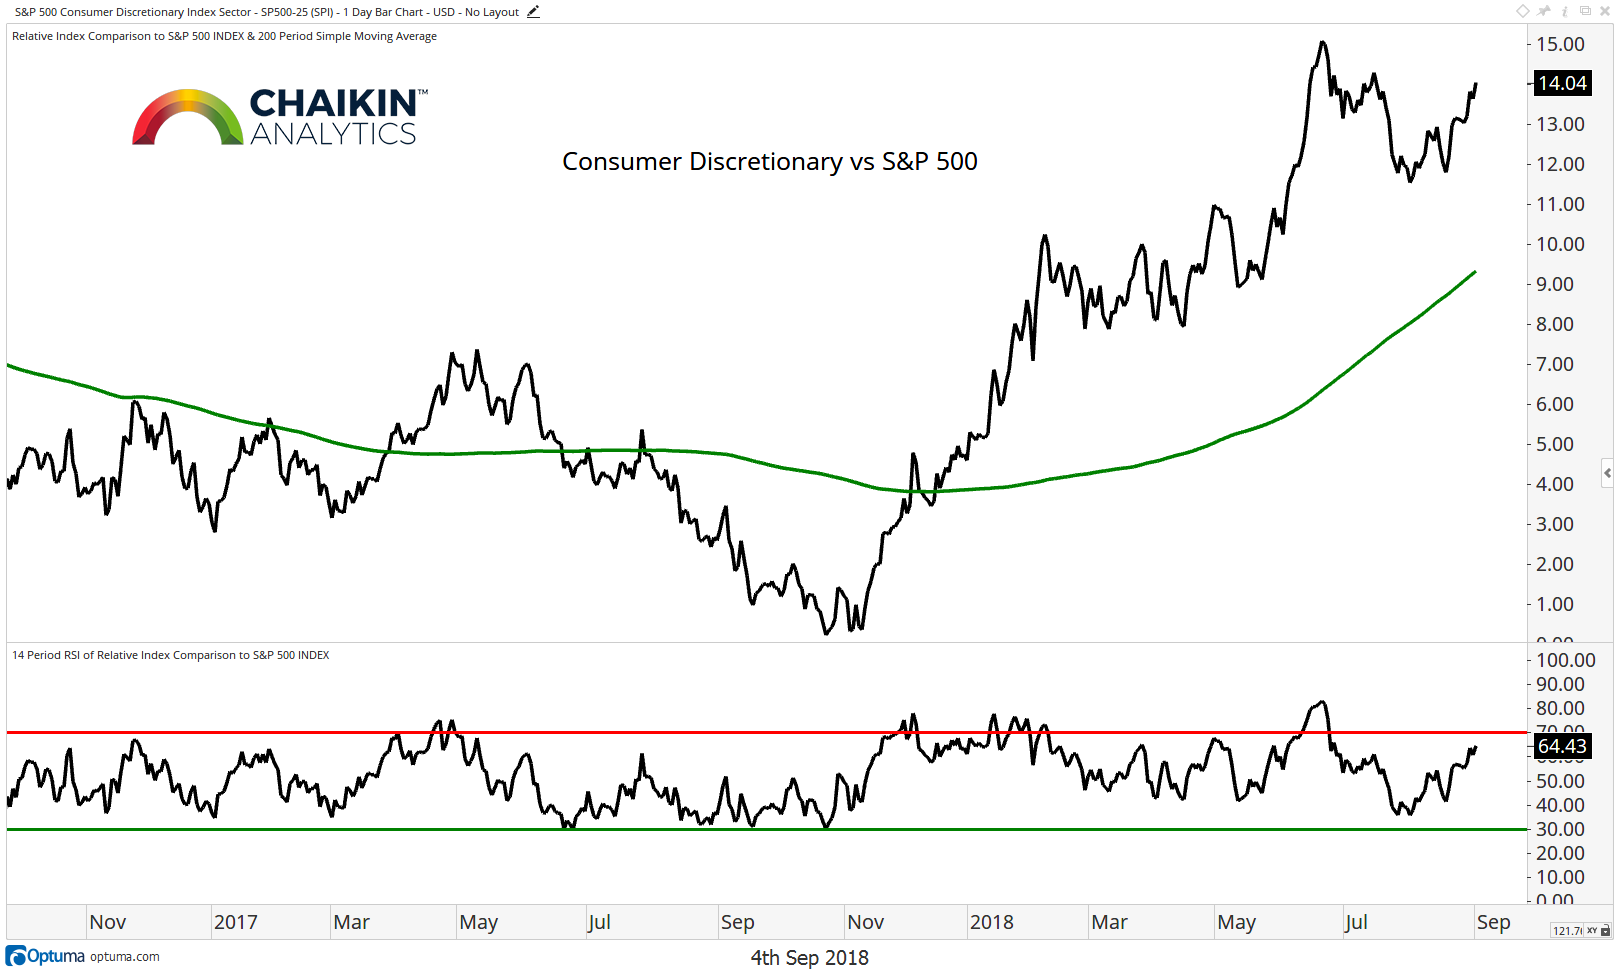
S&P 500 Consumer Discretionary Sector Relative to the S&P 500
The Consumer Discretionary sector continues to consolidate below the highs after becoming overbought but remains above the rising 200-day moving average. The RSI of the ratio has not become oversold since last October which speaks to the strength of the current uptrend. Note that AMZN is a large weight in this index and the Power Bar Ratio in Chaikin Analytics is skewed to the bearish side. Many of the industry groups in this sector have poor relative trends. We favor the Retail and Internet Retail stocks in this sector.
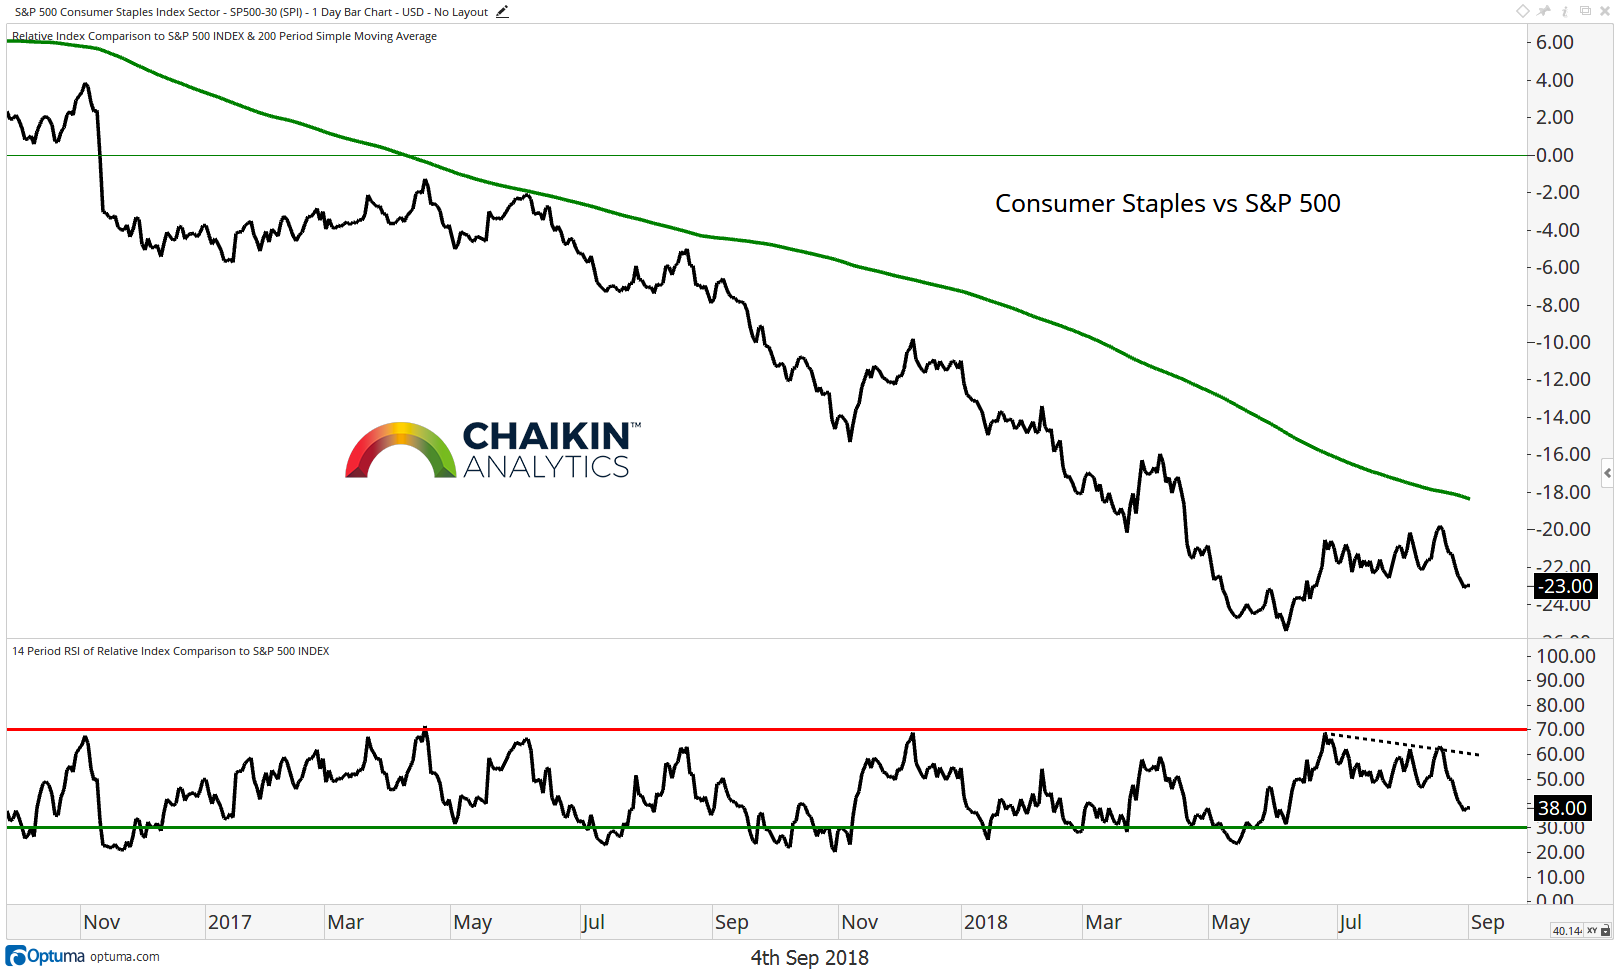
S&P 500 Consumer Staples Sector Relative to the S&P 500
On a relative basis, the Consumer Staples sector remains in a downtrend against the S&P 500 and the sector is, once again, moving lower following a few weeks of positive relative performance. The group remains below the falling 200-day moving average. The RSI is back in bearish ranges after failing to become overbought during the recent rally. In fact, the most recent price peak was met with a negative momentum divergence. Based on the Power Bars in Chaikin Analytics, the sector remains bearish and weaker than the SPY. Odds favor a resumption of the relative downtrend.
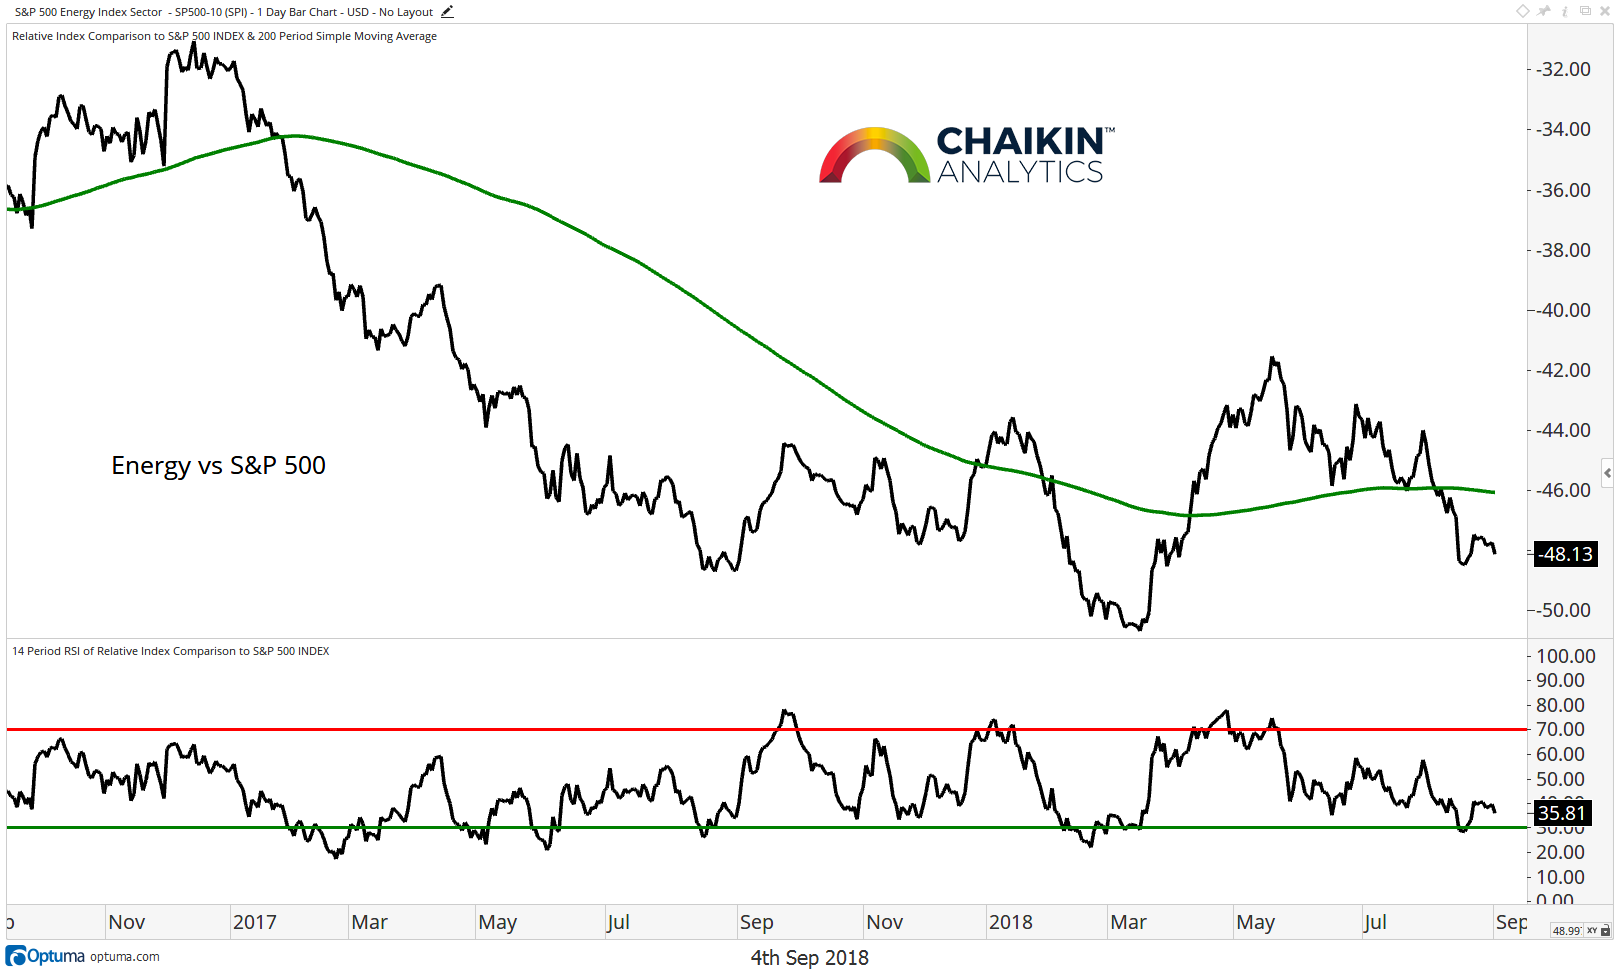
S&P 500 Energy Sector Relative to the S&P 500
The Energy sector is trying to form a bottom relative to the S&P 500 but is below the 200-day moving average. The RSI has recently become oversold, so a near-term rally can’t be ruled out. We want to see the ratio move above the May highs to have conviction that the trend is changing to bullish. The Power Bar Ratio for the sector has a bearish leaning which indicates that the shift to a bullish trend may take more time. During the bottoming process, we favor E&P and Refiners over Services stocks.
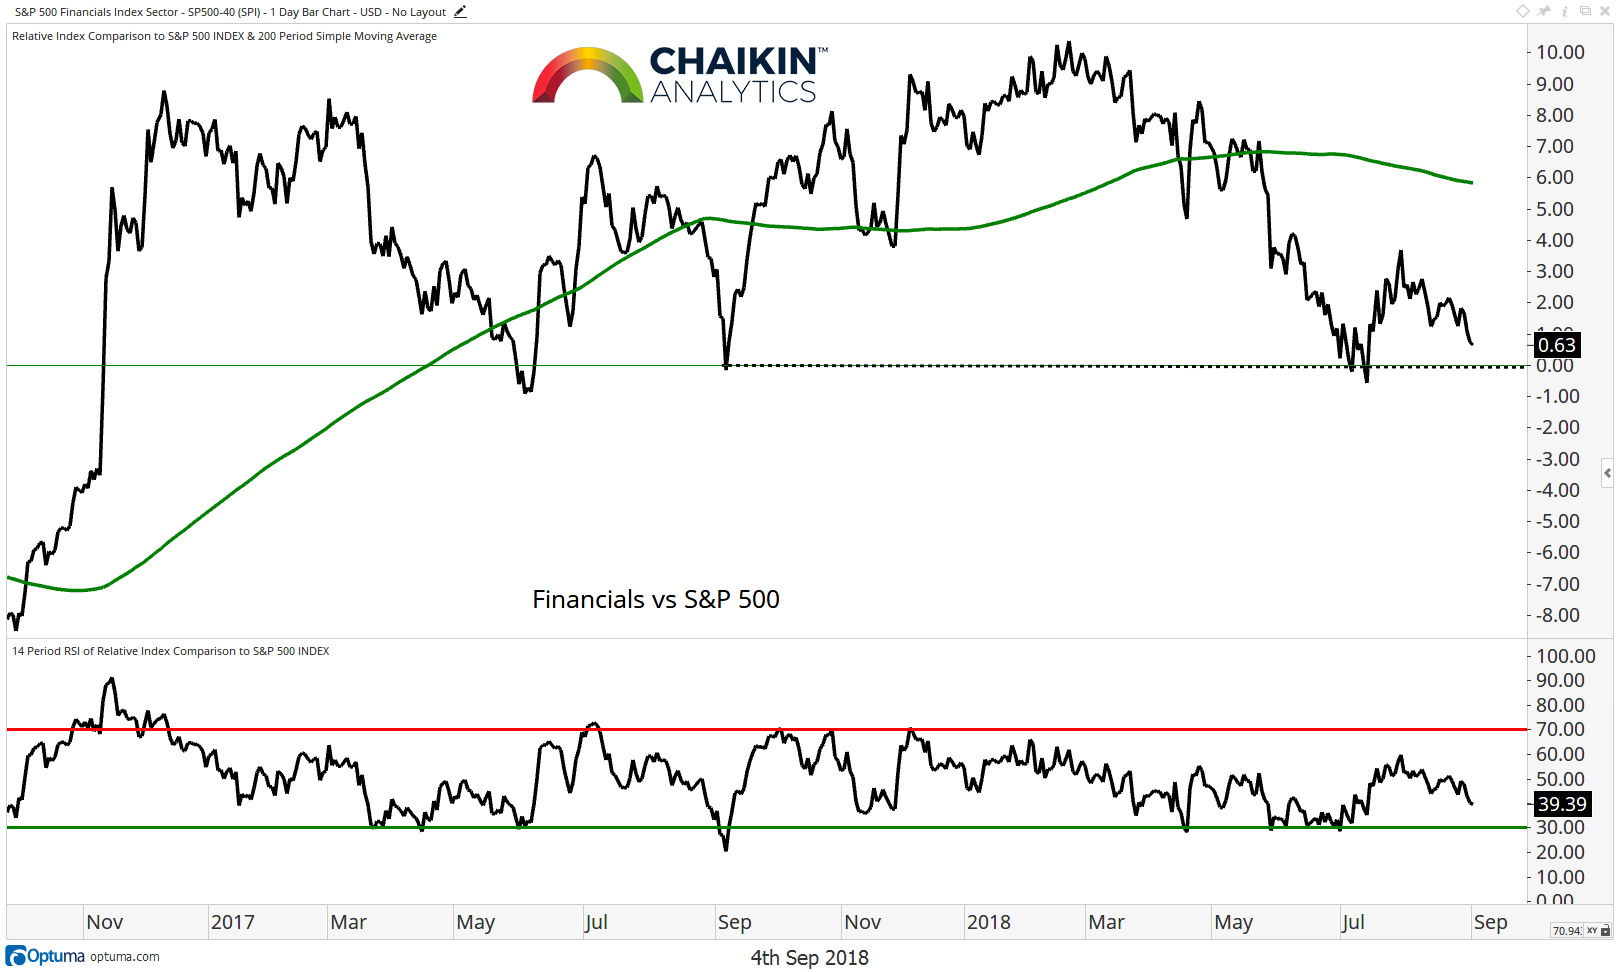
S&P 500 Financials Sector Relative to the S&P 500
The Financials Sector remains above price-based support but below the declining 200-day moving average. The RSI remains in bearish ranges. The sector has more upside toward the 200-day moving average, but we want to see a break to new highs to turn more bullish from a trend perspective. A break of support negates this view. The Power Bar Ratio for the sector is bullish but lags the SPY.
S&P 500 Health Care Sector Relative to the S&P 500
The Health Care sector has met resistance at the early 2018 highs relative to the S&P 500 but remains above the 200-day moving average (which is beginning to turn higher). Based on the Power Bars in Chaikin Analytics, the sector has the second best ratio and has been in the top four for more than two months.
Continue Reading On The Next Page…

: Creating Bullish Divergence?")


: Creating Bullish Divergence?")

