It’s been a tricky year for investors. The stock market spent first half of the year churning sideways before the sharp turn lower in August. Then came the October rally that reversed most of August’s losses. But either way you slice it, it’s been a volatile year and much is still undecided for Mr. Market.
With 5 weeks remaining in 2015, the S&P 500 will either decide to move higher and close out another successful year or drift sideways to lower and open the door to more uncertainty into early 2016.
As most investors are aware, stock market seasonality trends tend to be favorable into the holiday season and year end. But considering that we’ve been in a volatile environment this year, it’s not a bad sampling to look at the past 10 years as a proxy for post-Thanksgiving S&P 500 seasonality trends.
Welcome to the Age of Turbulence (hat tip – and no thanks to – Alan Greenspan).
Below you will find a table with the last 10 years of post-Thanksgiving day statistics for the S&P 500. I looked at S&P 500 seasonal trends the day after Thanksgiving, the week after Thanksgiving, the month of December, and Thanksgiving through year-end. Eat up. Here’s the breakdown:
S&P 500 Seasonality Trends Post-Thanksgiving (last 10 years)
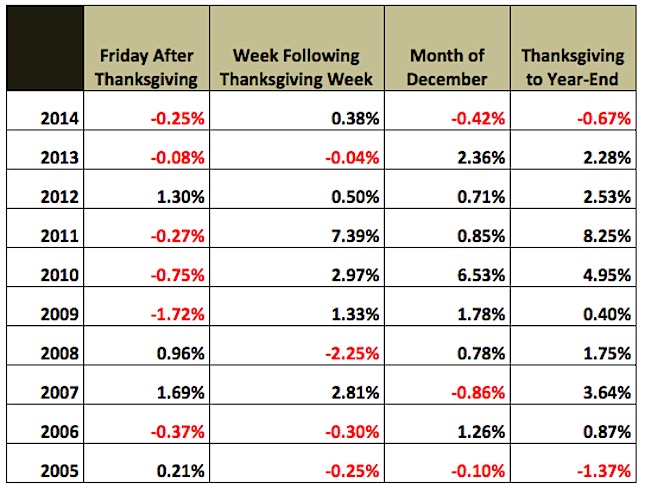
*Data sourced from YahooFinance.
A quick breakdown of the S&P 500 seasonality trends and statistics indicates that the day after Thanksgiving has been somewhat negative for the market. It’s been up 4 of the past 10 years (a coin flip), but down 5 of the past 6 years). But after that, the stock market trends turn decisively positive for investors as seasonality kicks in.
Here’s the recap:
- The week after Thanksgiving has been up 6 of the last 10 years and 5 out of the last 6 years.
- The month of December has been up 7 of the last 10 years, and 6 of the last 7 years.
- The entire period spanning Thanksgiving through year-end has been up 8 of the last 10 years.
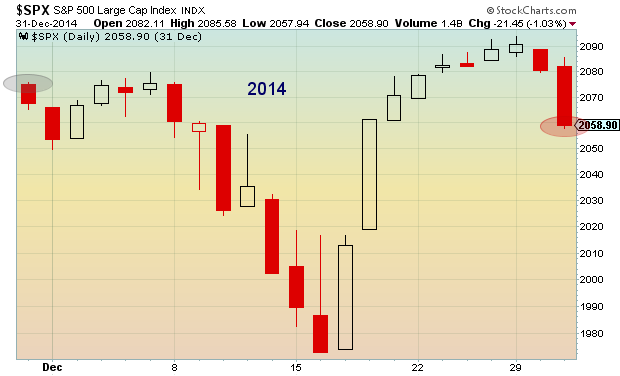
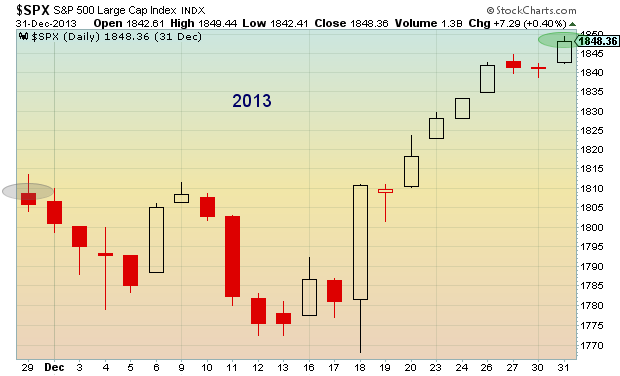
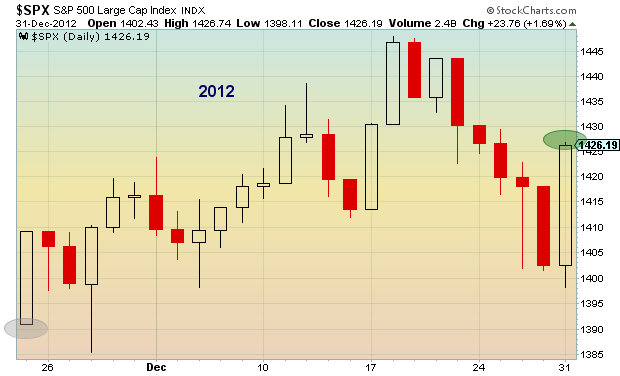
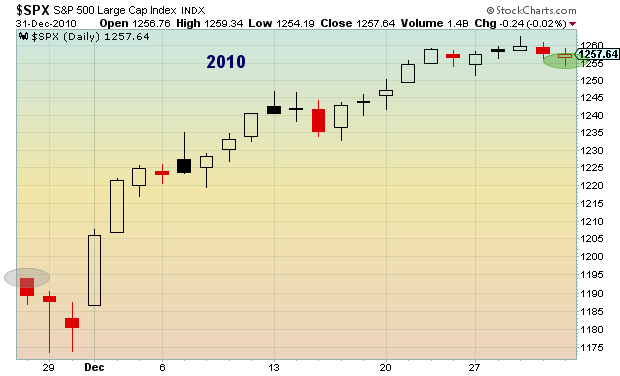
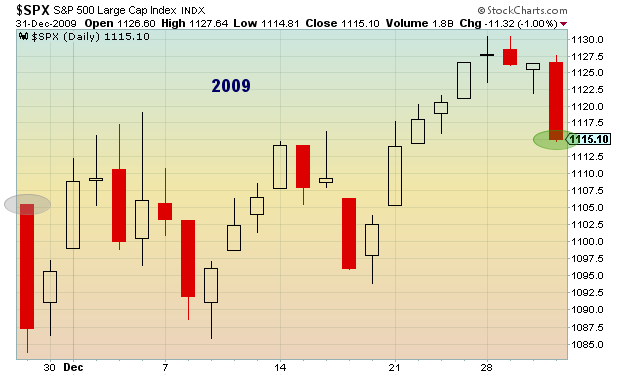
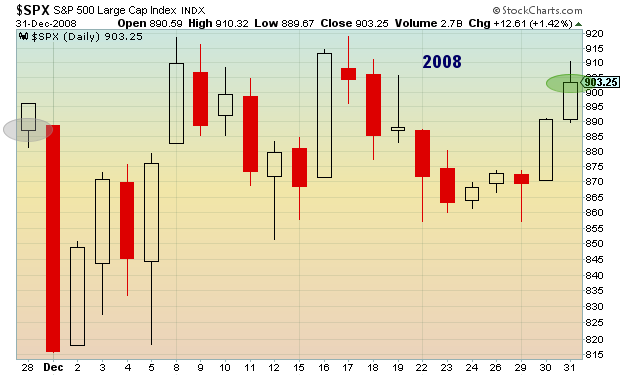
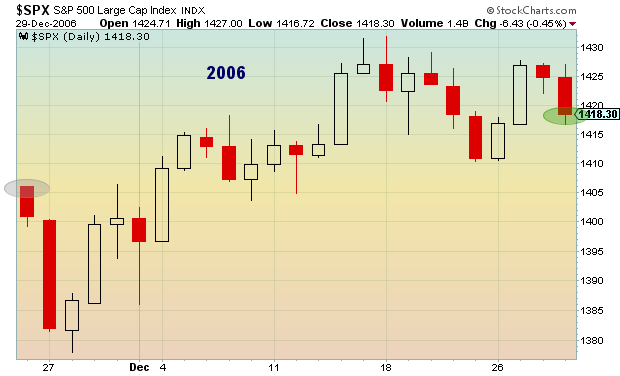
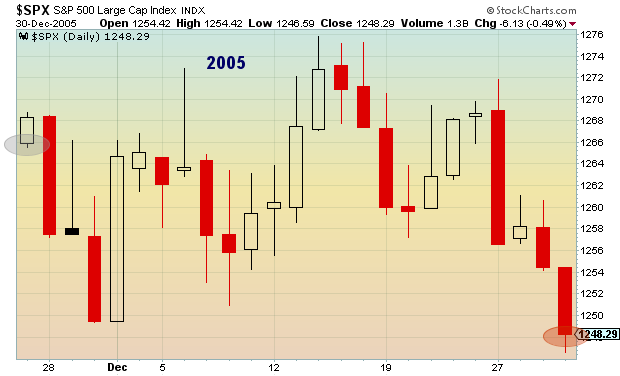
For those of you that like viewing the chart patterns more than reading about them, here’s a look at the last 10 years of post Thanksgiving stock market seasonality returns in charts.
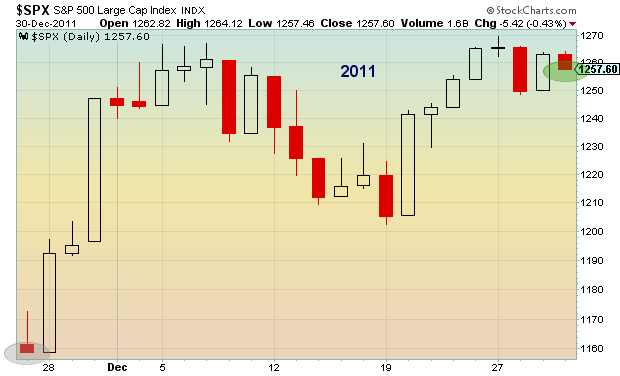
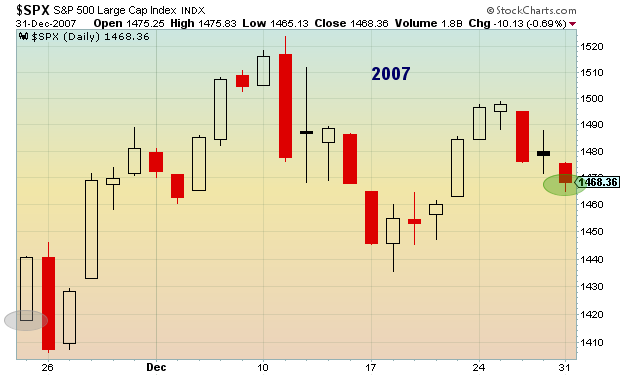
With stock market seasonality trends turning positive, investors hope that US equities can turn higher and close near historic long-term averages. But, as we all know, the past is not necessarily a predictor of the future. And this year has seen some volatile moves so bulls won’t want to get too cozy with the idea of guaranteed gains.
Thanks for reading.
Twitter: @andrewnyquist
No position in any of the mentioned securities. Any opinions expressed herein are solely those of the author, and do not in any way represent the views or opinions of any other person or entity.


