As we all know the stock market has recovered very sharply and fast since March when we saw a strong drop following coronavirus lockdowns.
The monetary policy has quickly changed and caused a rebound on financial assets after QE, stimulus packages, and lower rates.
Stock indexes are higher, some even beyond March levels even though COVID is not anywhere near the end; in fact, we see more and more lockdowns and restrictions happening globally each day. It is clear evidence that QE is driving the markets and not the real situation of the economy. But we have to realize that the stock market does not represent the economy; stock prices are driven by supply and demand, and it looks like more money printing obviously means more buying power.
I think that stock market is a good indicator for overall market sentiment, and currently we see more and more investors trying to jump on the train despite prices printing new all-time highs.
On the put/call index ratio, we can see that investors are buying a lot of calls as they believe that prices will be higher in the future. When calls move to an extreme, it usually means the opposite as we know that the market moves from pessimism to optimism and vice-versa. So if we respect past shifts in trends on the S&P 500 due to the PUT/CALL ratio extremes then we shall also be aware of a reversal now. I think there can be a risk-off, perhaps in 2021. It can be only temporary turn or pullback before we go even higher, but I think that it will provide a much better opportunity to look for investments when PUT/CALL will be at the other end of the extreme.
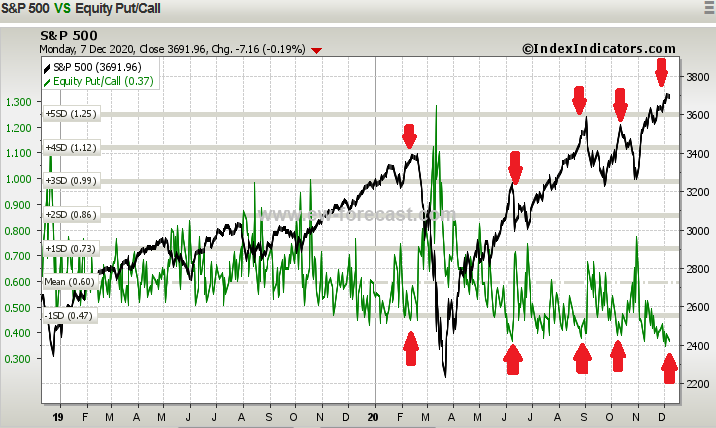
Source: IndexIndicators.com
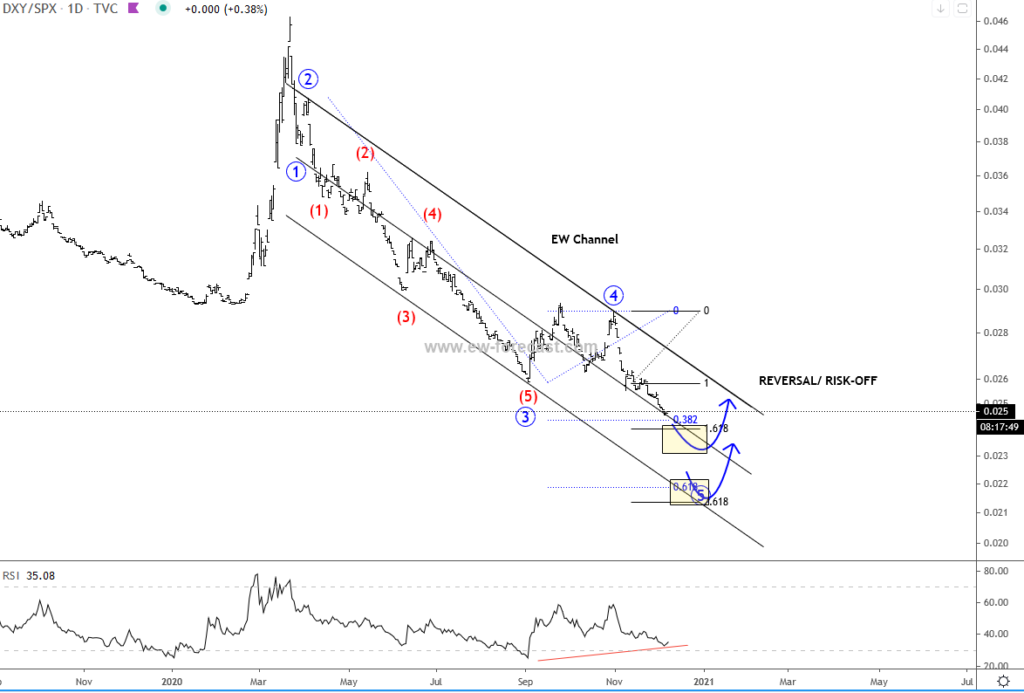
We know that when there is “risk-off” that cash is king, so normally the US Dollar will rise. Some may not agree because of money printing that drives down the value of currency. However, I believe there will be pullback even if the Dollar is going to crash, and this pullback may not be far away if we consider that DXY/SP500 ratio is seen in a fifth wave of a drop from March high. Based on Elliott Wave theory, the market is in final leg of current bearish development so next reaction is a counter-trend, normally in minimum three legs. And this goes perfectly with the PUT/CALL ratio view above.
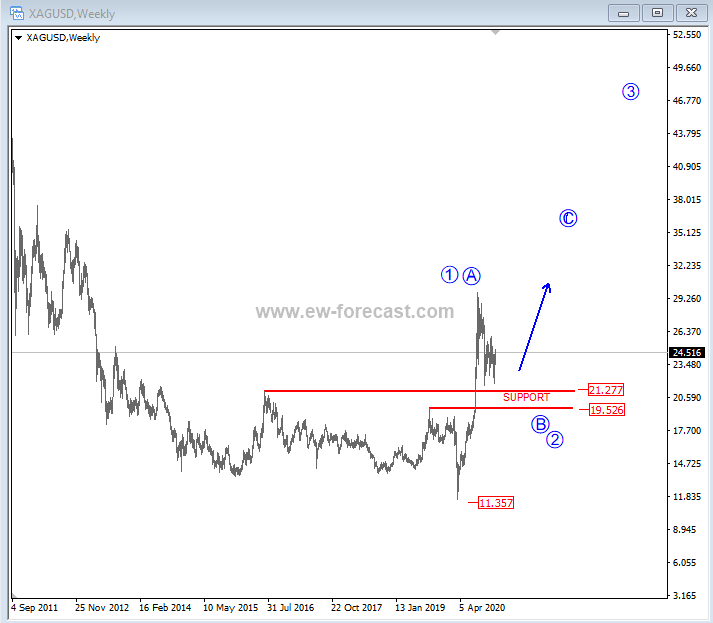
The reason why people move into cash during a stock market sell-off is because of fear; they feel much better and safer with “cash in hand” rather than invested in some stocks during volatile and uncertain times. However, some will look to hide in precious metals or bonds but this requires patience. I think Gold is very interesting from the fundamental perspective, but when looking at the price and upward potential I really love Silver.
Silver has a support here at 21/19 where current pullback can come to an end.
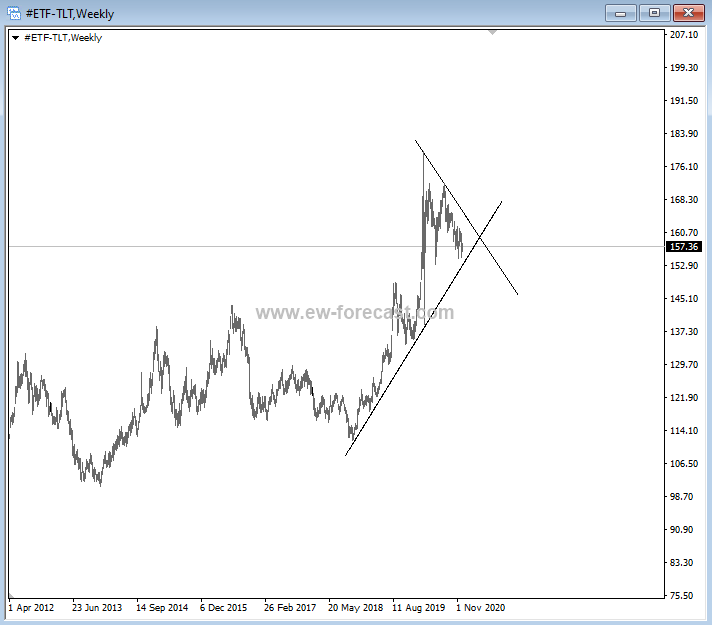
TLT is also one option but there have been times when even bonds and metals fell “during stock market shock” but then quickly stabilized. The TLT is looking quite interesting while it trades above the trendline support, but falling trendline shall be broken to confirm the resumption of an uptrend.
That’s it for today. If you love the analysis or you are interested in market-sentiment cycles then you may want to look at our Elliott Wave charts and research at www.ew-forecast.com, or on twitter.
Twitter: @GregaHorvatFX
The authors may have a position in the mentioned securities at the time of publication. Any opinions expressed herein are solely those of the author, and do not in any way represent the views or opinions of any other person or entity.
: Creating Bullish Divergence?")


: Creating Bullish Divergence?")