Over the last 5 months, the S&P 500 Index has formed a series of lower weekly closing highs. This pattern is concerning, especially if stocks aren’t able to surmount this downtrend line with a powerful move higher.
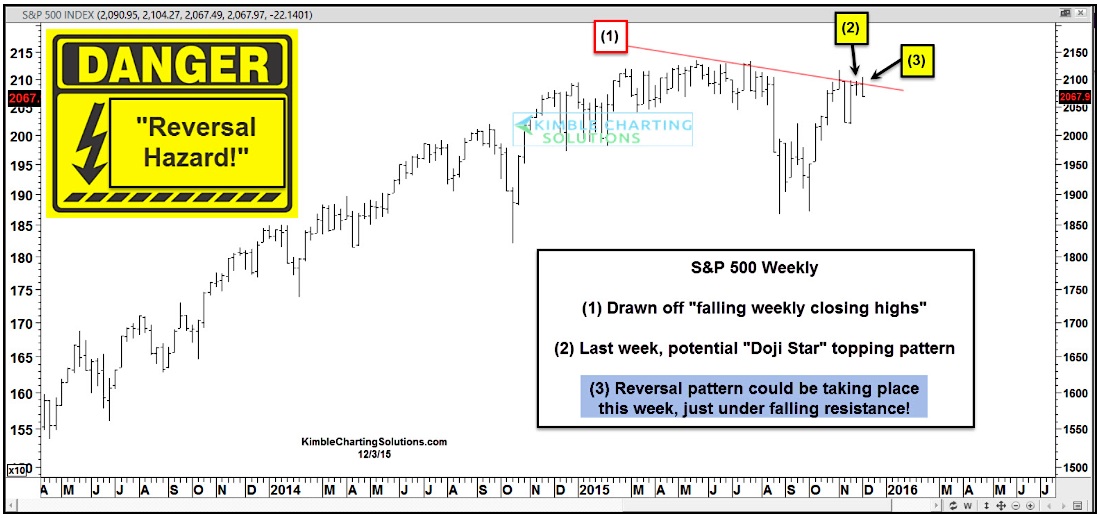
You can see this important trend line in the chart below – line (1).
Then last week the S&P 500 Index formed a “Doji Star” reversal pattern at point (2) on the chart.
And the cherry on top could be a follow through “reversal pattern” this week – see point (3) on the chart.
And all this may be occurring just under the S&P 500’s declining resistance trend line (1).
The takeaway: This reversal pattern has the potential to turn into a dangerous reversal move lower for stocks. Market bulls will want to make the price action “prove itself” by surmounting this key resistance.
There has been much written about positive stock market seasonality and the potential for a santa claus rally. But for this to take place, the first thing the S&P 500 Index needs to do is break above the descending trend line at point (1). If this occurs, then the odds move much higher that a stock market rally into year-end will take place.
Thanks for reading.
Twitter: @KimbleCharting
The author does not have a position in the mentioned securities at the time of publication. Any opinions expressed herein are solely those of the author, and do not in any way represent the views or opinions of any other person or entity.


: Showing Some Signs of Emerging Strength")
