When we were in the throws of the last whoosh lower for the stock market, I wrote an article sharing important Fibonacci levels to watch for the bear market.
I highlighted the 38.2 Fibonacci level at 3815 as an important level for bulls to hold. Well, we hit 3810 and reversed higher and have rallied over 340 points since.
Now it’s time to see if this rally has legs. To do so, we need to establish some guideposts to follow. So once again we will use Fibonacci retracement levels. And even if a low is established, it will likely need to be tested at some point. That test may start from a key retracement resistance level.
Note that the following MarketSmith charts are built with Investors Business Daily’s product suite.
I am an Investors Business Daily (IBD) partner and promote the use of their products. The entire platform offers a good mix of analysts, education, and technical and fundamental data.
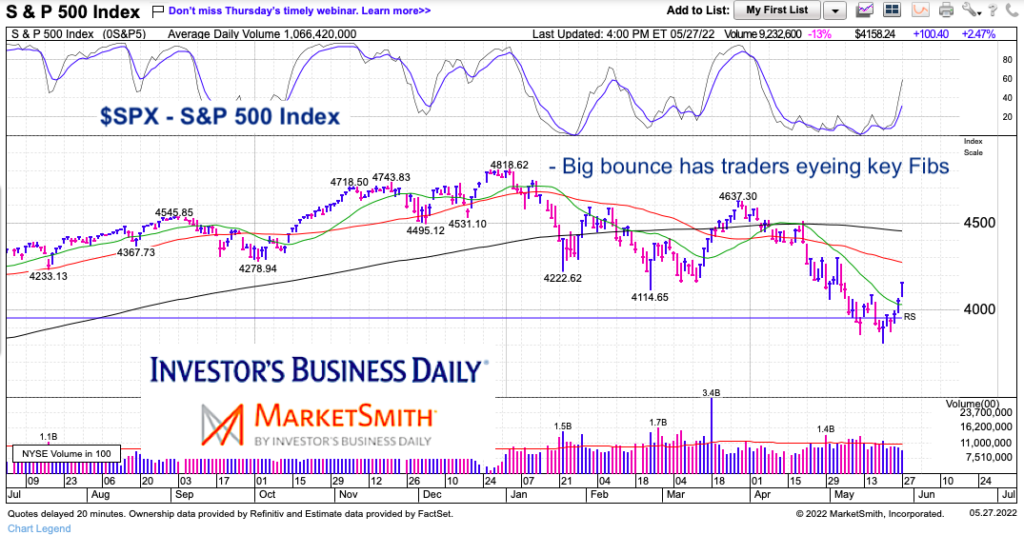
S&P 500 Index Chart
For this exercise, we use the 4818 peak and the 3810 low to establish 38.2, 50, and 61.8 Fibonacci levels. In addition to these levels, it’s also good to note the 50 and 200 day moving averages.
First up is the 38.2 Fib level at 4195. That will be important to watch. Then comes the 50 Fib level at 4314 which is also near the 50 day moving average. Clearly this area will be strong resistance. Last up is the 61.8 Fib at 4432 which is also near the 200 day moving average. Keep these guideposts in mind when looking for a reversal.
Twitter: @andrewnyquist
The author may have a position in mentioned securities at the time of publication. Any opinions expressed herein are solely those of the author, and do not in any way represent the views or opinions of any other person or entity.

: Showing Some Signs of Emerging Strength")
