Many active investors (and everyday 401Kers) are asking how low the market will go?
While t’s difficult to forecast lows in a bear market (or a correction for that matter), it’s best to follow guideposts.
Guideposts are technical price levels of relevance (trend lines, memory supports, fibonacci levels).
Today we take a simple look at some important Fibonacci price retracement support levels. While these may not mark THE LOW, they may mark a trading low, or even just areas to put small amounts of money to work (depending on risk and time frame – i.e. trader vs long-term investor).
Note that the following MarketSmith charts are built with Investors Business Daily’s product suite.
I am an Investors Business Daily (IBD) partner and promote the use of their products. The entire platform offers a good mix of analysts, education, and technical and fundamental data.
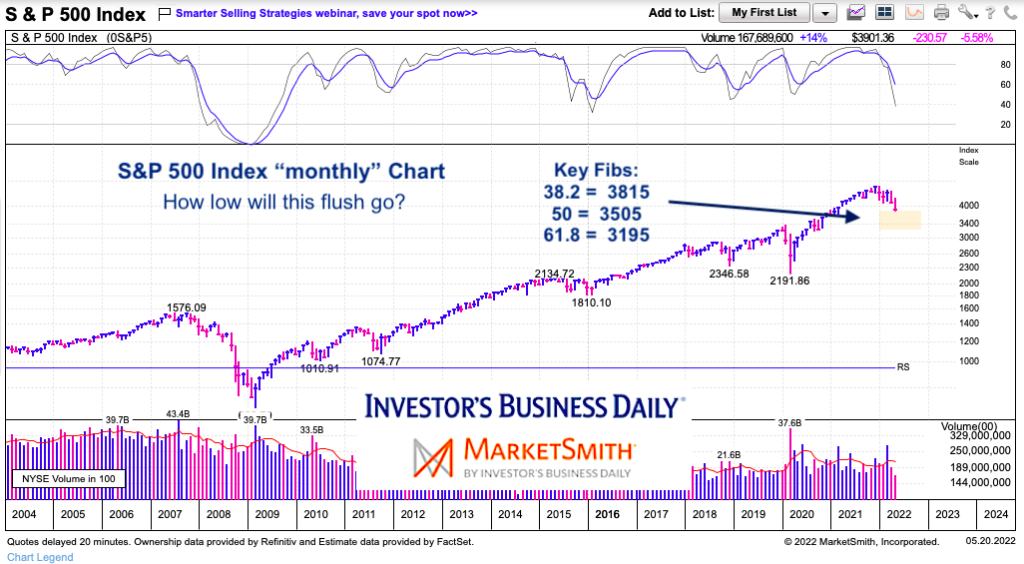
S&P 500 Index “monthly” Chart
When we zoom out, it doesn’t look like we’ve come down all that much (even though the recent low marked a +20 percent decline). That said, momentum is still falling and price needs to stabilize.
Thus far, we have come into our first key Fibonacci retracement support (of 2020 low to 2022 high) – the 38.2 Fib (3815). This is a key area and bulls would like to see price hold and stabilize here. Even if it does, it doesn’t rule out another turn lower.
Below that is the 50 Fib (3505) and the 61.8 Fib (3195). For now, watch the 3800 area and stick to a mindful plan.
Twitter: @andrewnyquist
The author may have a position in mentioned securities at the time of publication. Any opinions expressed herein are solely those of the author, and do not in any way represent the views or opinions of any other person or entity.


 Flirting With Critical Support… Again")


