We often write about markets in the context of monthly and weekly charts, but many traders prefer to work on a faster basis. It’s helpful then to have a trading method that matches your own speed and style and that you can adjust to suit a variety of market conditions.
For example, if you’re a trader who prefers not to leave positions open through the weekend, you might look for opportunities that show up within the larger moves printed on our weekly charts. The fractal nature of Elliott wave analysis can be a great help in identifying those faster trades, and additional tools improve the certainty of those trades.
In this post, we use the S&P 500 Index (SPX) to show a trading approach in a market that is already trending. First we show where we think the market is right now in relation to an Elliott wave structure, and then we offer a framework of three elements – structure, momentum, and timing – for identifying faster trades in that context.
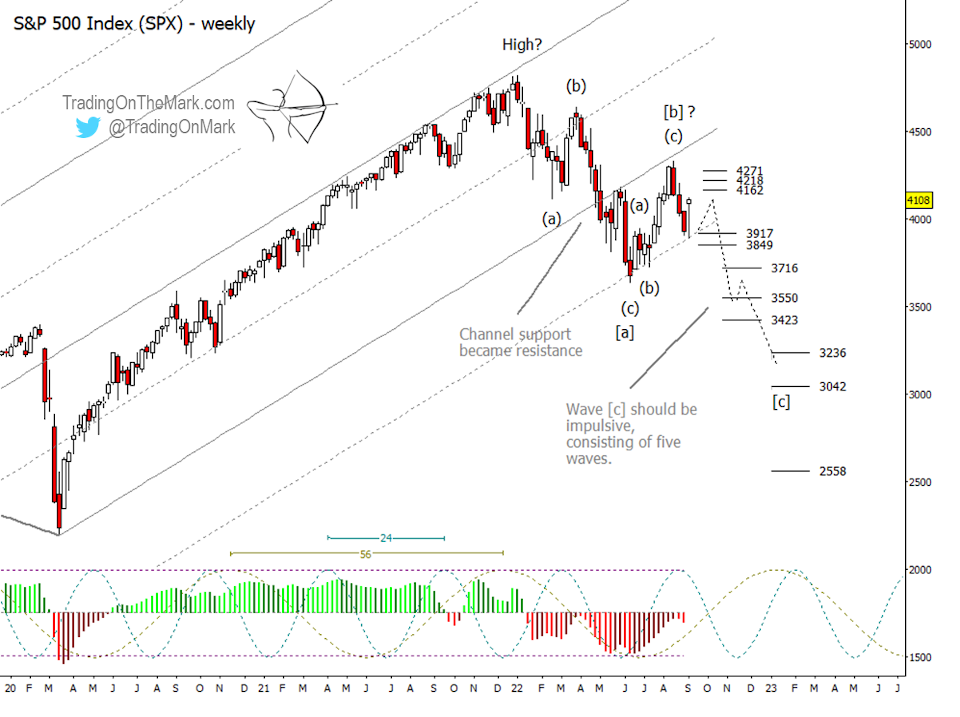
On a weekly chart we’re medium-term bearish for the equity indices. The most decisive confirmation of that view has been the way previous channel support transformed into resistance. From that perspective, we see a series of lower highs and lower lows, suggesting that continuation trades on a weekly time frame would be short positions.
In terms of structure, there was a nice three-wave formation leading into the June low. We expect that to be just the first part of a larger corrective pattern. Our favored scenario has SPX tracing an [a]-[b]-[c] pattern that would last approximately a year, i.e. going into 2023. It remains to be seen whether this year’s structure will constitute the entirety of the correction or if additional sideways/down pattern segments will be needed heading into 2024.
If the assignment of the [a]-[b]-[c] structure is correct, then wave [c] should consist of five sub-waves. That expectation gives us the start of a framework for trading moves too fast to track properly on a weekly chart.
The current price move is climbing away from the support areas we have marked at 3917 and 3849. Resistance areas for a simple bounce await at 4162, 4218 and 4271. (An alternative scenario could have the retrace climb a bit higher than those levels and surpass the August high. That would make wave [b] higher and more lengthy than what’s shown on the chart, and we would re-label the wave count accordingly.)
Lower supports sit at 3716, 3550 and 3423. More fundamental supports wait at 3236, 3042, and 2558. Levels such as those are often where the sub-waves begin and end within the larger move. As we are expecting five sub-waves during this part of the decline, we can develop a sense of where to catch the downward trades and where to exit them based on the price levels and other signals.
We mentioned a framework of three elements for identifying trades. The first element was structure, which we have already touched on with our description of Elliott wave expectations. For example, we expect the current decline to consist of five sub-waves.
Certain algorithms such as the DeMark sequential indicators and the Wave59 Nine-Five tool can fill in for Elliott wave analysis. They provide a similar but less nuanced interpretation of wave structure by counting advances and retreats in price.
Regardless of which approach you use, an understanding of pattern structure helps the experienced trader identify the favorable direction for continuation trades and the likelihood of a turn nearby.
The other elements in this system for identifying trades are momentum and timing. To make use of them in the context of an Elliott wave weekly chart, as shown above, we take the time frame “down” one level to examine daily candles.
On the daily SPX chart below, we see the output of the Adaptive CCI, which tracks price momentum, and the Lomb periodogram, which estimates where the market is versus an assumed price/time cycle. The two outputs look similar – rows of squiggles beneath the price candles – but they serve different purposes and are best used in conjunction with each other.
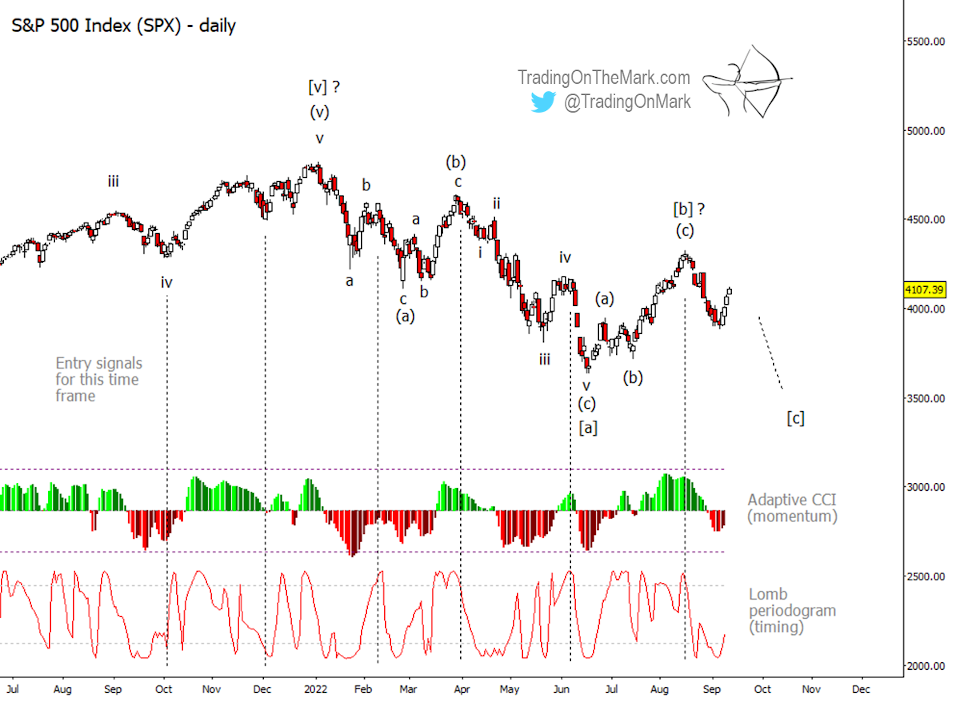
On the daily chart we have marked the locations of six viable trade entries, with the first two being long and the remaining four being short. The direction of trading is set by the structural analysis discussed earlier.
Note how all the trades are preceded by a “pullback” in the momentum indicator, which can be thought of as measuring a spring that is coiled and storing energy. The best reversal signals with this indicator also feature some price “divergence”. For example price might extend a few bars higher while the momentum indicator prints a lower reading, or vice-versa.
Other behaviors we watch for with this particular indicator include an approach and pull-away from the center line and sometimes an extension of the readout to the edge of the indicator’s typical range. The latter is often best used as an exit signal rather than for entries.
Although the Lomb periodogram may appear similar to the momentum readout, it’s meant to tell you something different. The algorithm tries to predict when price “should” be going up or down based on an assumed underlying cycle in recent price action. It does not attempt to tell you how far price should move or whether it has already moved far enough. Note how the Lomb offers help finding ideal entry moments on the daily chart.
There are other momentum and timing tools that can serve the same purposes, although these are the ones we are most attuned to. The value of this trading approach is not the choice of specific tools (although we think Elliott wave is very useful!) but rather to analyze the data from three different directions that are somewhat independent of each other. With the right approach and good guidance, trading can be consistently profitable.


