In this week’s investing research outlook, we will analyze the current trend of the S&P 500 Index (INDEXSP:.INX), check in on investor sentiment and market breadth indicators, and discuss emerging themes and news that we are watching right now.
Here’s a summary of our findings for the week ending September 29, 2017:
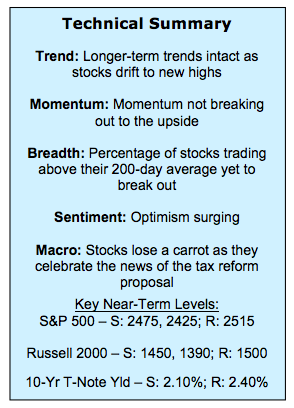
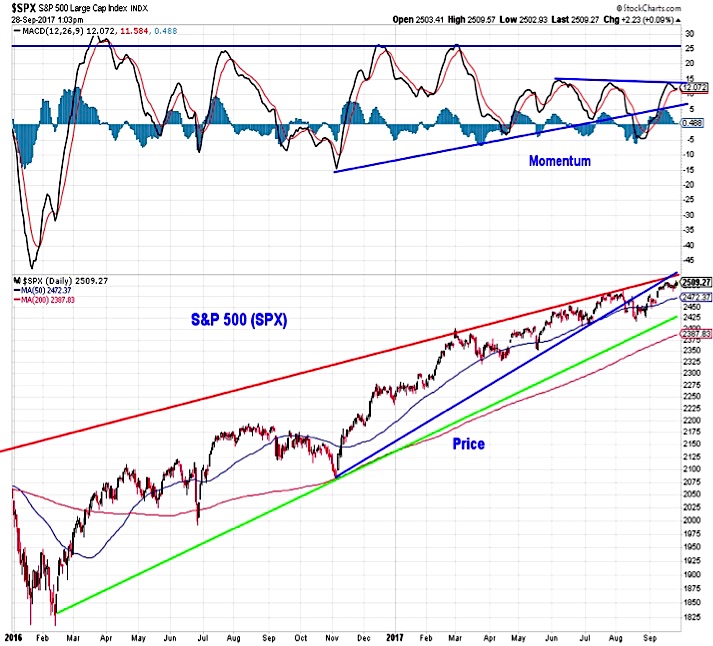
Stocks Defy Seasonal Weakness – Stocks have rallied over the course of September, building on the strength that emerged over the second half of August. This continues a dominant theme for 2017 (a relative lack of drawdowns) and could leave stocks with a modest tailwind heading into the final quarter of the year. Still lacking, however, has been a meaningful expansion in momentum for the S&P 500.
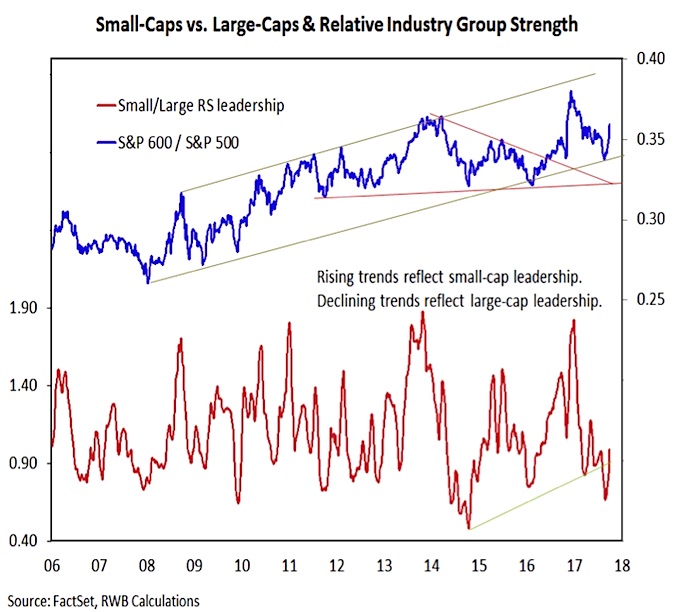
Small-Caps Making A Move– After being left for dead following peak-to-trough decline of 7% culminating with a break of the 200-day average in mid-August, the small-cap Russell 2000 has come roaring back to life, moving to new all-times highs on expanding momentum and breaking through a downtrend relative to the S&P 500 that had emerged over the course of 2017. While index-level strength has been notable, industry group-level trends have not yet provided confirmation.
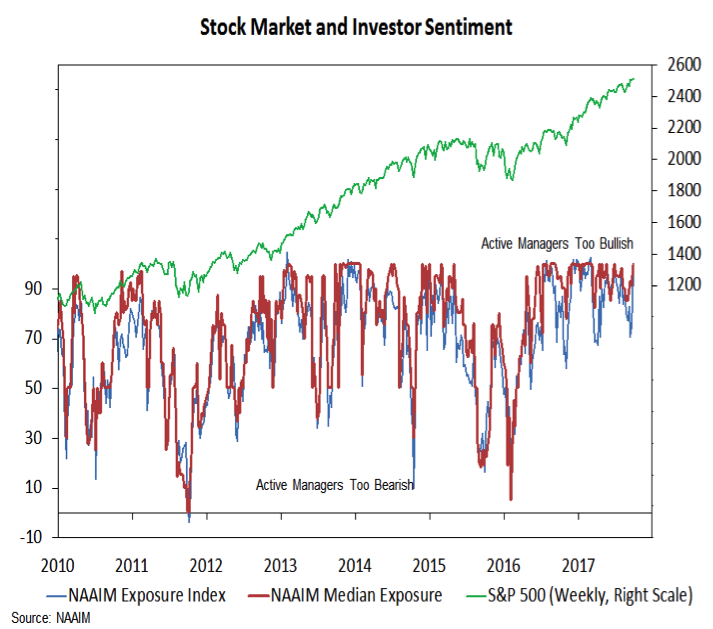
Optimism Pushing Higher – The sentiment indicators are showing renewed (and excessive) optimism. Details from the NAAIM survey suggest remaining bears have capitulated and the short-term NDR trading sentiment composite is again on the cusp of excessive optimism.
Stock Market Indicators
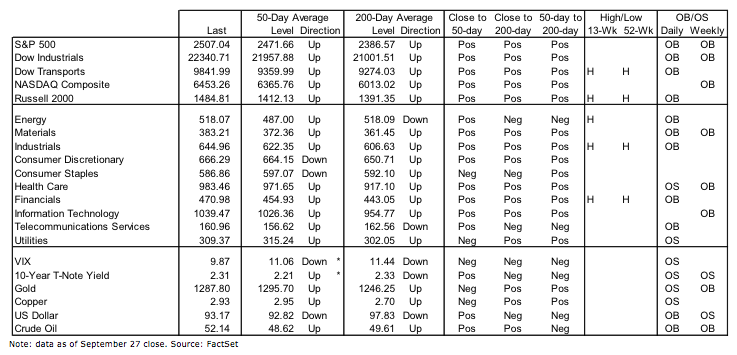
S&P 500 Index
Stocks have defied well-advertised September seasonal weakness to move toward quarter-end at or near new all-time highs. While this has bullish implications for the fourth quarter as a whole, the S&P 500 has yet to give a clear signal that it is poised for a meaningful move higher. It has drifted higher to new highs, but remains below trend-line resistance and momentum has rolled over near the mid-year peaks (shy of the momentum peaks seen in late 2016 and early 2017).
Russell 2000 Index & Small Caps
While the S&P 500 has not seen a 5% pullback in more than a year (currently the longest stretch with such a move since 1995), the Russell 2000 saw a 7% decline this summer, culminating with a mid-August break of its 200-day average. That weakness has helped fuel surging momentum as the index has rallied (rolling down a hill can help generate momentum to climb up a hill). Small-caps have also benefitted from tax-reform related headlines and a bounce in the U.S. dollar.
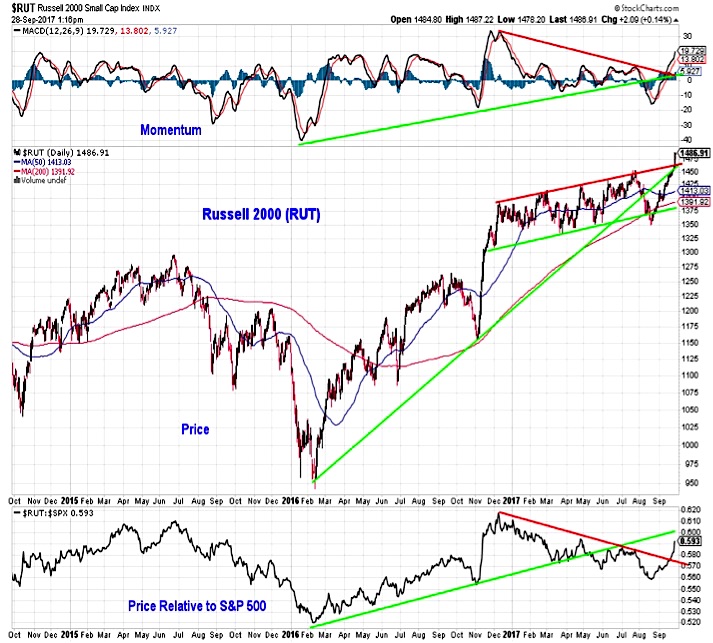
The index-level strength in small-caps (looking at either the Russell 2000 or the S&P 600) has been more notable than the improvement seen at the industry group level. If small-caps are going to build on the strength seen over the past six weeks, industry group trends may need to show more pronounced small-cap leadership.
Investor Sentiment
September strength leaves stocks somewhat overbought at a time when optimism has re-entered the system (optimism never really left, but it has found renewed life this week). Bulls on the Investors Intelligence survey moved up to 54% and bears dropped to 17%, near their lowest level of the year. A potentially more significant shift was seen in the NAAIM data. The overall exposure index jumped from 75% to 96%, with the deviation of responses narrowing dramatically (from 48% to 26%). The bearish contingent, who began to throw in the towel last week, continued to capitulate this week. The most respondent with the most bearish allocation was still 90% long equities, this highest reading in the history of the survey.
continue reading on the next page…

: Creating Bullish Divergence?")


: Creating Bullish Divergence?")

