There could be trouble on the horizon for the equities markets… if this Elliott wave pattern is correct.
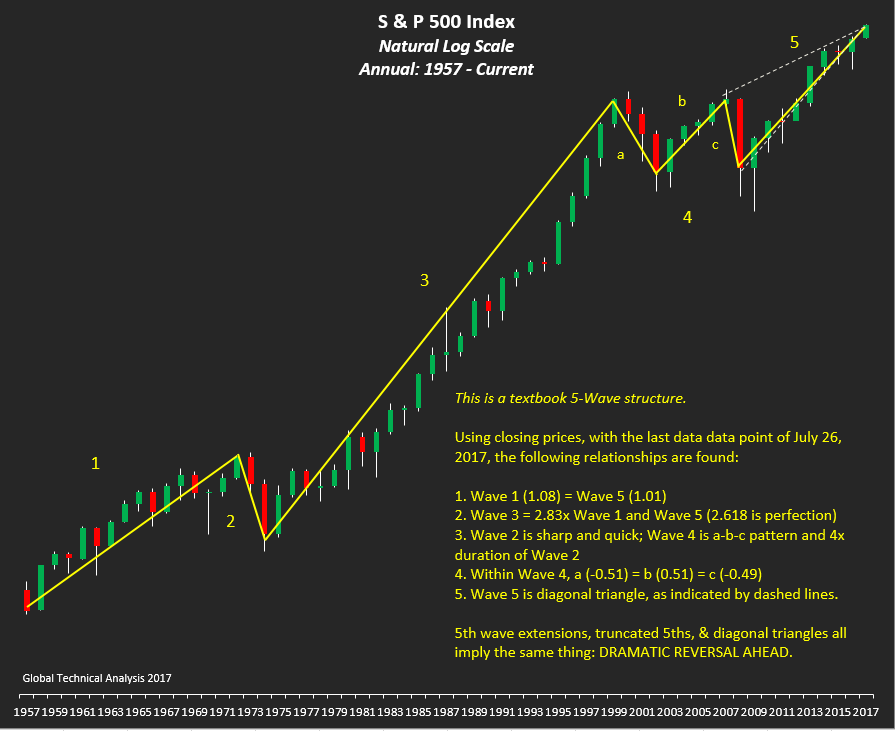
Below looks at a long-term chart of the S&P 500 Index (INDEXSP:.INX) from 1957 to present, pointing out Elliott wave counts.
This is a textbook 5 wave structure that looks like an S&P 500 Elliott wave top is nearing.
Using closing prices with the last data point coming on July 26, the following “wave” relationships are found:
1. Wave 1 (1.08) = Wave 5 (1.01)
2. Wave 3 = 2.83x Wave 1 and Wave 5 (2.618 is perfection)
3. Wave 2 is sharp and quick while Wave 4 is a-b-c pattern and 4x the duration of Wave 2.
4. Within Wave 4, a (-0.51) = b (0.51) = c (-0.49)
5. Wave 5 is a diagonal triangle (as indicated by dotted lines).
Also note that 5th wave extensions, truncated 5ths and diagonal triangles all imply the same thing: A DRAMATIC REVERSAL AHEAD.
ALSO READ: S&P 500 Volatility Near Historic Lows
S&P 500 Long-Term Chart with Elliott wave overlay
Check out more of my research over at Global Technical Analysis. Thanks for reading.
Twitter: @Techs_Global
Any opinions expressed herein are solely those of the author, and do not in any way represent the views or opinions of any other person or entity. The author doesn’t not have a position in the mentioned securities at the time of publication.


 Flirting With Critical Support… Again")