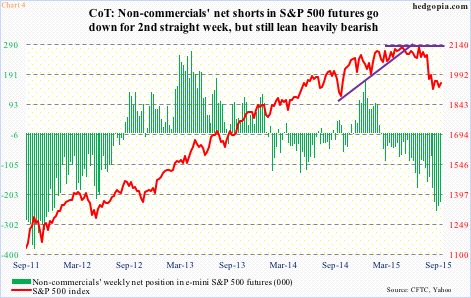
As of August 25, a day after the index made an intra-day low of 1867, non-commercials’ net shorts in e-mini S&P 500 futures were 75,744 contracts.
Then the index went on to rally eight-plus percent by September 17. Throughout this, these traders continued to add, peaking at 258,900 by September 15 (see Chart 4 below).
They were not convinced the rally was real, and were vindicated in some ways in that the index did come under renewed pressure, dropping to 1872 by September 29. In the meantime, net shorts have been reduced to 227,575. These are still massive holdings.
COT Report Chart: Non-Commercials Net Shorts
The question is, how might last Friday’s reversal in U.S. stocks have impacted non-commercials’ conviction, if at all? We would not know until Friday.
If we see a sustained drop in both SPY short interest and non-commercials’ net shorts, this rally may have legs. If not, it is bound to soon fizzle out.
The Friday reversal is important, but important enough to nullify all the technical damage wrought on major U.S. indices by the August sell-off? Probably not. (see Chart 5 below) On the S&P 500, from monthly bearish MACD crossover (in April this year) to the index dropping below its 20-month exponential moving average in September, there are tons of reasons to worry long-term.
S&P 500 Daily Chart (1 Year)
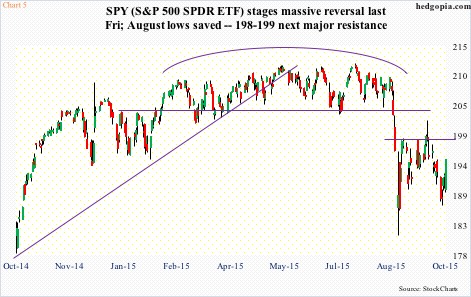
Even so, we cannot just shut eyes to Friday’s action. Near-term, odds have grown SPY ($195) will at least test resistance at $198-$199. The declining 50-day moving average lies at $199.59. The daily MACD has crossed up, and momentum indicators are oversold. In the meantime, VIX seems to want to go lower – a certainty once/if it loses its 50-day moving average, which it is currently sitting on. This could be setting up well for a strategy to generate income using short-term options – cash-secured puts to be precise.
Hypothetically, October 9th weekly 192.50 puts are selling for $1.07. SPY options are currently priced for it to move just below $4 this week – either up or down. If the options market is right, and the ETF makes a move to the downside, it is a long at $191.43. If the move is to the upside, the ETF will go test that afore-mentioned resistance, and the premium is kept.
Thanks for reading!
Twitter: @hedgopia
No position in any of the mentioned securities at the time of publication. Any opinions expressed herein are solely those of the author, and do not in any way represent the views or opinions of any other person or entity.

 Testing Important Price Support")
: Cup (and Maybe Handle) Watch")

