The stock market declined sharply yet again on Thursday, as the Dow Jones Industrial Average fell over 1000 points for the second time this week.
Stocks are now reaching into correction territory as investors attempt to size up the damage.
In today’s update we’ll breakdown the latest action for stocks and bonds while sharing some important investing research for the week ahead.
Key Takeaways: The recent up-tick in stock market volatility is in sharp contrast to the historically anomalous calm that persisted for most of 2017. Continued upward pressure in bond yields suggests market volatility could stick around. As stocks look to regain their footing, it will be important to see market breadth improve and investor optimism continue to unwind.
What began as a stumble last week gained momentum this week and the S&P 500 has now given back all of it gains for 2018 (at its peak it was up more than 7% YTD) and then some. The speed at which stocks have pulled back has caught investors off guard and exposed some cracks in underlying façade.
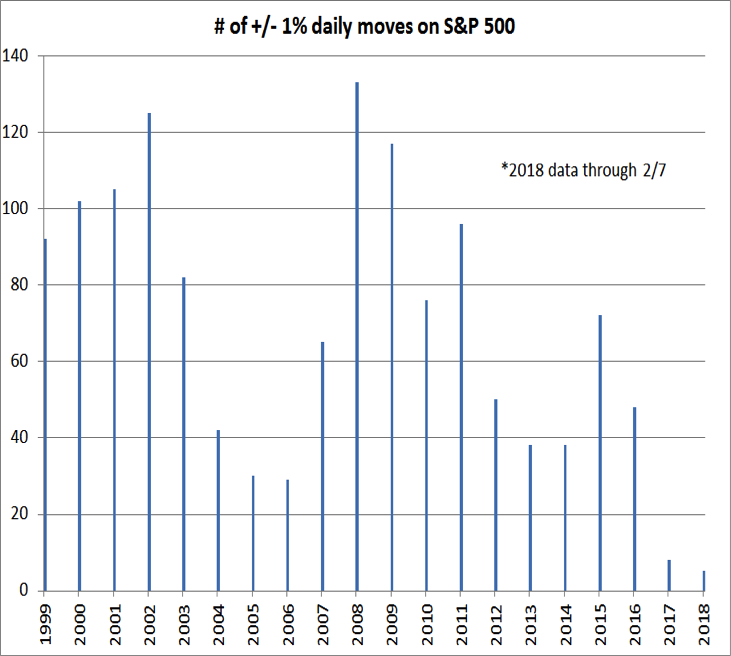
After seeing a total of eight moves of up or down 1 percent in 2017, we have already experienced six in 2018 (assuming today closes down over 1 percent). As the chart shown further below shows, the historical anomaly was 2017, not 2018. This is an important reminder to investors that 2018 is not 2017 when it comes to the stock market. If the pattern of recent years returns, the pace of 1 percent swings in stock prices may not slow down much from what we have seen so far in 2018. At this point, it is too early to know the full extent of the damage done to the underlying trend. If today’s re-test of the early week lows can hold (the number of issues making new lows and intra-day momentum are both offering evidence of positive divergences) and lead to a successful challenge of the S&P 500’s 50-day average (near 2720), it would be evidence that near-term conditions are improving. But that’s still in question… note that this post was written prior to market close Thursday.
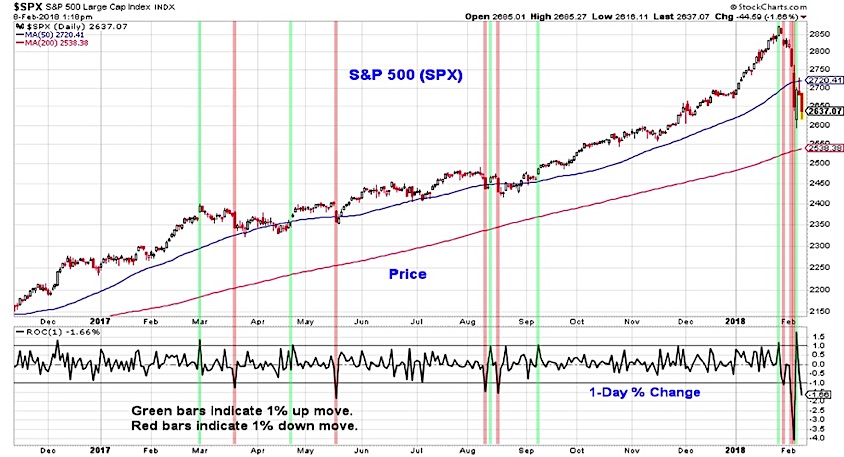
The eight daily moves of +/- 1 percent in 2017 stand out as a historical anomaly. Over the preceding 15 years, the number of such moves ranged between 29 (in 2006) and 133 (in 2008) and with a median of 65. This represents more than five such moves in any given month, five we have seen already in 2018 seem relatively normal. The lack of volatility over the course of 2017 led to heightened interest in short volatility derivatives and the unwinding of these trades likely acted as an accelerant in this week’s trading.
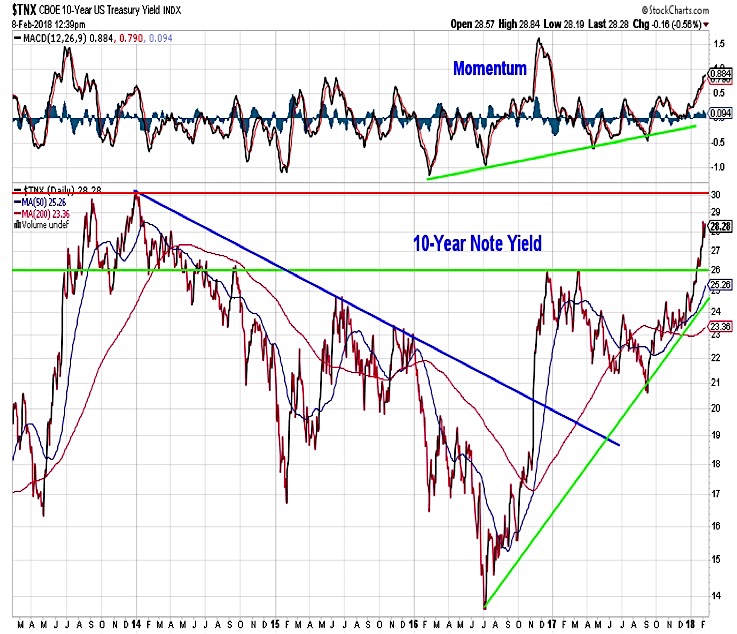
In addition to the deterioration seen in stocks since mid-January (Stock Rally Hits Some Bumps, Loses Some Luster) another significant contributor to the recent weakness has been the sustained rise in bond yields. Even as stocks have sold off over the past week, the yield on the 10-year T-Note has continued to climb, reaching its highest level since 2014 and closing in on 3.0% (currently it is at 2.85%). This likely reflects strong global growth and the move higher in global bond yields, but may also be a specific reaction to increasingly expansionary fiscal policy (increasing the supply of Treasuries) while the Fed shrinks its balance sheet (reducing demand for Treasuries). The effect is that stocks are no longer getting bailed out by pullbacks in bond yields at the first signs of trouble.
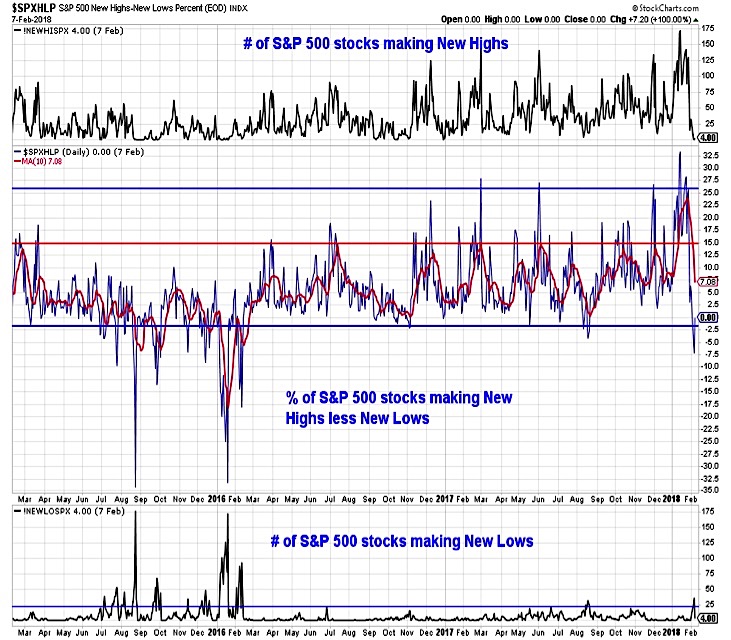
While watching the price action on the popular averages for evidence that stocks are finding their footing, we also need to look beneath the surface for signs of healing. A healthy rally that is able to persist should break the downside momentum that emerged this week. Additionally, the number of stocks making new lows should stop expanding and the number of stocks that are more than 20% from their 52-week highs (currently 27% of the S&P 1500) would be expected to contract. A rally in the S&P 500 that does not come with broad support may be vulnerable to reversal.
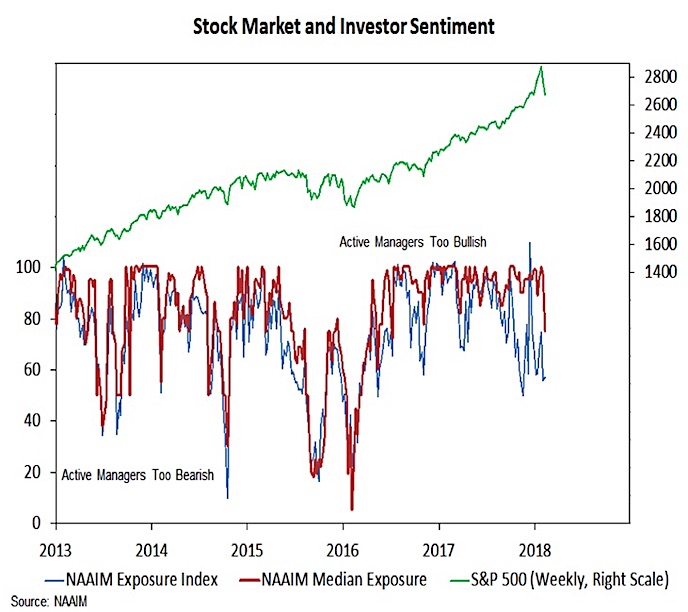
We also need to see an unwind in the excessive optimism that was widespread in investor sentiment surveys. On a short-term basis, we are seeing evidence of that. Daily sentiment indexes and the NDR Trading Sentiment Composite are now showing evidence of pessimism. Also encouraging has been the shift away from the record optimism seen on the Investors Intelligence survey and evidence from the NAAIM that active investment managers have reduced equity exposure. While the NAAIM Exposure Index has fluctuated since late 2017, median exposure had remained elevated. This week saw a drop in median exposure from 97% down to 75%, the lowest level since mid 2016. While still a ways from pessimism, this retreat in optimism on the NAAIM (and Investors Intelligence) surveys is welcomed.
Thanks for reading.
Twitter: @WillieDelwiche
Any opinions expressed herein are solely those of the author, and do not in any way represent the views or opinions of any other person or entity.


