S&P 500 Trading Outlook (2-3 Days): BULLISH, but…
The S&P 500 is (INDEXSP:.INX) nearing resistance which could cause this rally to stall out directly over 2600.
Active investors can stay long equities through the pre/post Thanksgiving holiday, but momentum has failed to lead stock prices back to new highs, and is well below areas that marked highs back in early November. While trends remain positive, increasing amounts of selectivity should again be important heading into end of month.
My bottom line: Upside price targets lie at 2610-5 in S&P 500 Futures, just fractionally above current levels. Any weakness in December which breaks last week’s lows-2557- would be thought to extend into mid-to-late December before a final push higher to end the year.
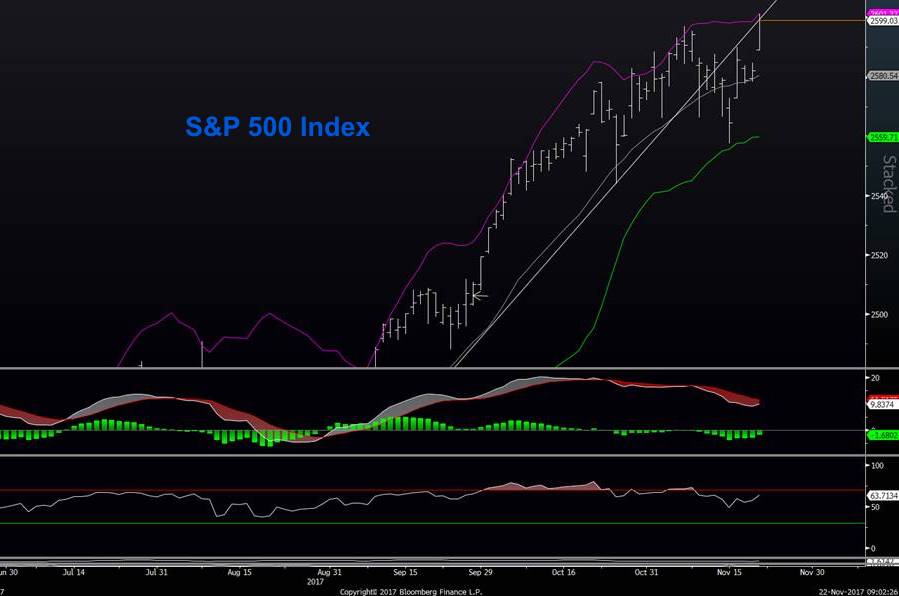
S&P 500 Chart Spotlight
The broad stock market index is back at new highs again. Pullbacks have consistently proven to be quite shallow, but we are late in this game. There are some concerns with being able to push up too much in the short run given the extent of our recent rally while the trend has begun to flatten out a bit. See BOLLINGER BAND resistance with bands NOT expanding here. Momentum remains negative.
For now, Wednesday and Friday should bring positive seasonality. 2610-15 should be eyed as a possible upside price target
Technical Thoughts
Most major US stock market indices have moved back to new highs territory, with just two trading days left in this holiday shortened week (note that there are only six trading days left in the month of November). Market breadth finished at 2/1 positive yesterday as 10 of 11 sectors finished positive. The move was led by Technology and Healthcare, the latter finally showing some signs of life after a dismal few weeks.
The Philly Semiconductor index finally surpassed its closing highs from March 2000, while coming within 20 points of its intra-month highs achieved back 17 years ago. Bonds rallied a bit yesterday, while the Yield curve continued to drop in fairly dramatic fashion, with 2/10s now hitting 58 bps, a fairly pronounced drop from 85 bps seen less than a month ago. Meanwhile the VIX (INDEXCBOE:VIX) has also dropped back down under 10, but remains above November lows, and July lows, despite markets having broken out again back to new high territory.
This lack of follow-through in momentum could prove to be a bigger deal as we approach early December, as markets still only show 57% of SPX names above their 10-day moving average as of 11/20/17 close. As mentioned a few weeks ago, the breadth and momentum deterioration which had been a concern for equities as sentiment reached extremes remains a factor as to why this rally has not nearly been as broad-based as what people might think. Despite 10 of 11 sectors rallying yesterday, breadth only turned in 2/1 positive. And for all the Hoopla surrounding indices back at new highs, Technology (NASDAQ:QQQ) yet again seems to be carrying the heaviest load, while Financials (NYSEARCA:XLF) have barely recouped 50% of the selloff seen from mid-October.
If you are an institutional investor and have an interest in seeing timely intra-day market updates on my private twitter feed, please follow @NewtonAdvisors. Also, feel free to send me an email at info@newtonadvisor.com regarding how my Technical work can add alpha to your portfolio management process.
Twitter: @MarkNewtonCMT
Author has positions in mentioned securities at the time of publication. Any opinions expressed herein are solely those of the author, and do not in any way represent the views or opinions of any other person or entity.


