S&P 500 Trading Outlook (2-3 Days): BEARISH
Upside is limited for the S&P 500 Index (INDEXSP:.INX) and a downturn in the Financials Sector (NYSEARCA:XLF) along with IWM, SML, and MID should have an effect on the S&P 500. A move under 2461 this morning should lead the market lower. Near-term targets: 2450 and 2437 on S&P 500 Futures.
Technical Thoughts
Similar to Tuesday’s finish, prices are failing after struggling to make headway. The signal for investors was seeing small caps and mid caps give up gains yesterday, while Financials (XLF) closed negative.
Bonds gained ground with the DC Drama reaching potentially a peak which many believe might finally result in stock indices paying attention. However,the deterioration in Small and Mid-cap stocks hasn’t had much effect on the broader market over the past few days. Only a serious downturn in both Financials and Technology will shake this uptrend and cause some deeper rolling over in price.
The first group, Financials, certainly has begun to fade as Treasury yields pulled back over the last 24 hours. Meanwhile, the Energy sector has continued its recent slide, hitting new 2017 lows in XLE, XOP and OIH with little to no real evidence of any real support outside of 2016 lows for OIH (which look to be directly below). Crude oil looks to be the real culprit in this regard, as WTI Crude Oil has broken down below key trendline support that had held since May.
Through yesterday, the percentage of stocks trading above their 50-day moving average remained at 52.78%, so roughly half, while only 46% of all stocks are trading above their 10-day ma. Those numbers will likely change for the worse today.
The slide in the Equal-weighted S&P 500 and QQQ vs their cap-weighted ETFs do look to be important and negative developments over the last month. However, prices will need to reflect this weakness, and show a bit more deterioration than what was on display during Wednesday’s session… we’re seeing that this morning but will need to wait for the close.
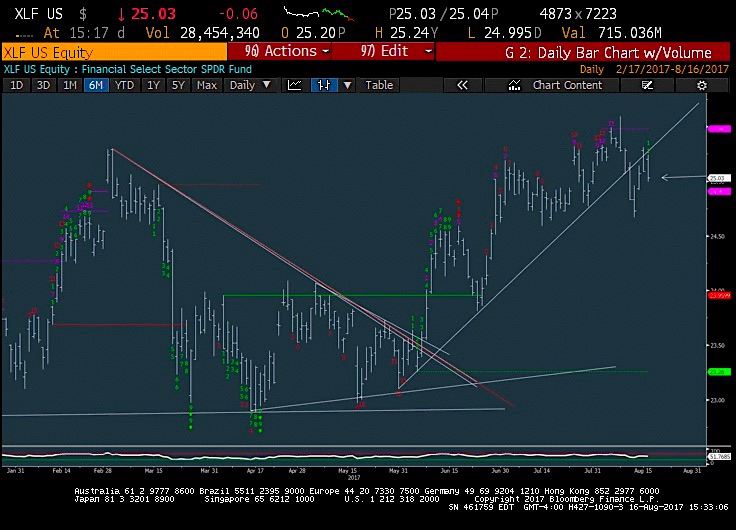
Chart Spotlight: Financial Sector (XLF)
Financials have gradually lost ground in the last week and even on retest attempts of the two-month uptrend from May lows, look to have failed. This group is instrumental to how the market acts given its size as 2nd largest sector. Therefore, any wavering that isn’t immediately replaced by Technology is thought to be a concern. Treasury yields have largely backtracked and until 2.28% is exceeded for the 10-Year Yield, Financials very well could back off further. Last week’s 24.67 lows are very important to the overall structure and cannot be breached without causing a much bigger pullback down to 23.00-23.25.
Thanks for reading and good luck out there.
If you are an institutional investor and have an interest in seeing timely intra-day market updates on my private twitter feed, please follow @NewtonAdvisors. Also, feel free to send me an email at info@newtonadvisor.com regarding how my Technical work can add alpha to your portfolio management process.
Twitter: @MarkNewtonCMT
Author has positions in mentioned securities at the time of publication. Any opinions expressed herein are solely those of the author, and do not in any way represent the views or opinions of any other person or entity.


